Global Malaria Programme, HIV/AIDS, Tuberculosis, Malaria & Neglected Tropical Diseases Cluster, World Health Organization, Geneva, Switzerland.
PLoS Med. 2011 Dec;8(12):e1001142. doi: 10.1371/journal.pmed.1001142. Epub 2011 Dec 20.
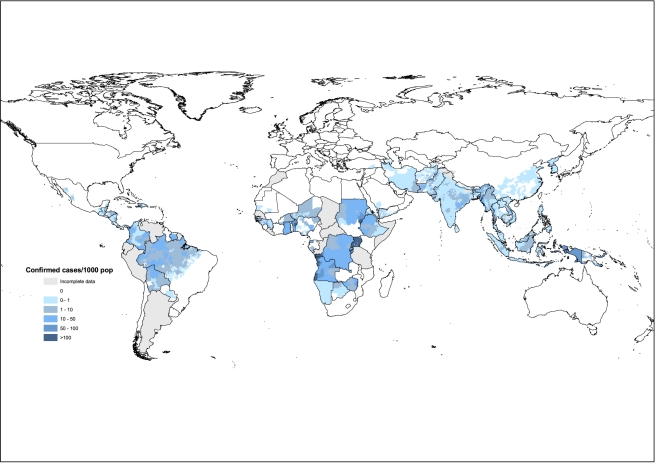
Measuring progress towards Millennium Development Goal 6, including estimates of, and time trends in, the number of malaria cases, has relied on risk maps constructed from surveys of parasite prevalence, and on routine case reports compiled by health ministries. Here we present a critique of both methods, illustrated with national incidence estimates for 2009.
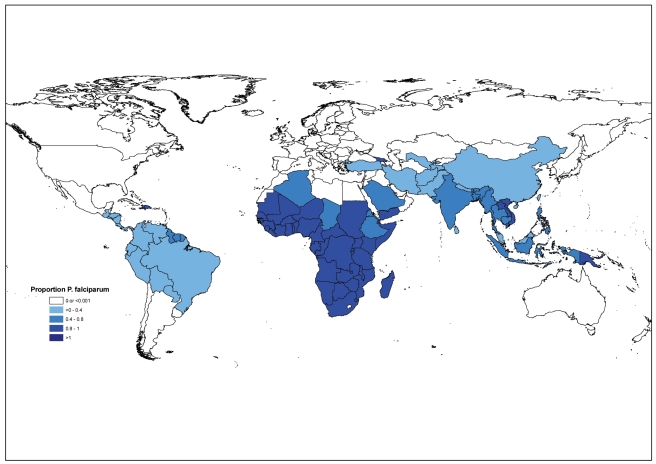
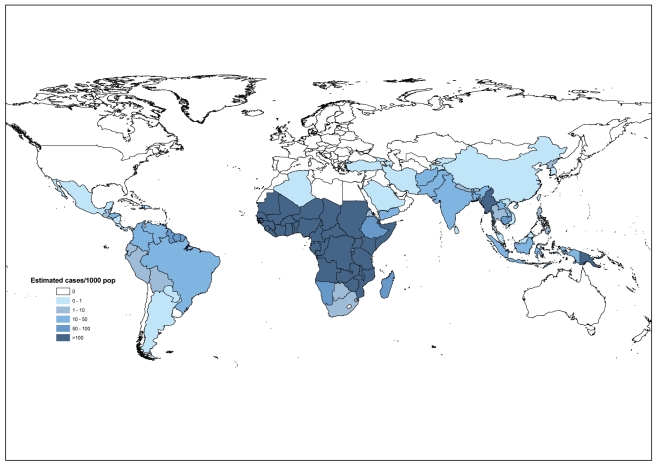
We compiled information on the number of cases reported by National Malaria Control Programs in 99 countries with ongoing malaria transmission. For 71 countries we estimated the total incidence of Plasmodium falciparum and P. vivax by adjusting the number of reported cases using data on reporting completeness, the proportion of suspects that are parasite-positive, the proportion of confirmed cases due to each Plasmodium species, and the extent to which patients use public sector health facilities. All four factors varied markedly among countries and regions. For 28 African countries with less reliable routine surveillance data, we estimated the number of cases from model-based methods that link measures of malaria transmission with case incidence. In 2009, 98% of cases were due to P. falciparum in Africa and 65% in other regions. There were an estimated 225 million malaria cases (5th-95th centiles, 146-316 million) worldwide, 176 (110-248) million in the African region, and 49 (36-68) million elsewhere. Our estimates are lower than other published figures, especially survey-based estimates for non-African countries.
Estimates of malaria incidence derived from routine surveillance data were typically lower than those derived from surveys of parasite prevalence. Carefully interpreted surveillance data can be used to monitor malaria trends in response to control efforts, and to highlight areas where malaria programs and health information systems need to be strengthened. As malaria incidence declines around the world, evaluation of control efforts will increasingly rely on robust systems of routine surveillance.
衡量千年发展目标 6 的进展情况,包括疟疾病例数的估计数和时间趋势,都依赖于利用寄生虫流行率调查结果构建的风险图,以及卫生部汇编的常规病例报告。在此,我们对这两种方法进行了批评,并结合 2009 年的国家发病率估计值进行了说明。
我们汇编了 99 个疟疾传播持续国家的国家疟疾控制规划报告的病例数信息。对于 71 个国家,我们通过利用报告完整性数据、寄生虫阳性可疑病例比例、每个疟疾病种的确诊病例比例以及患者使用公共部门卫生设施的程度,对报告病例数进行调整,从而估计了恶性疟原虫和间日疟原虫的总发病率。所有这四个因素在国家和地区之间都有很大差异。对于常规监测数据可靠性较低的 28 个非洲国家,我们根据基于模型的方法来估计病例数,该方法将疟疾传播的衡量标准与病例发病率联系起来。2009 年,非洲 98%的病例是由恶性疟原虫引起的,而其他地区为 65%。全球估计有 2.25 亿疟疾病例(第 5-95 个百分位数,1.46-3.16 亿),非洲区域有 1.76 亿(1.10-2.48 亿),其他地区有 4900 万(3600-6800 万)。我们的估计值低于其他已公布的数据,特别是非非洲国家的基于调查的估计值。
从常规监测数据中得出的疟疾发病率估计值通常低于从寄生虫流行率调查中得出的估计值。经过仔细解释的监测数据可用于监测控制工作中的疟疾趋势,并突出显示需要加强疟疾规划和卫生信息系统的领域。随着世界各地疟疾发病率的下降,对控制工作的评估将越来越依赖于健全的常规监测系统。