Natural and Exact Sciences Department, Higher School of Health Technology of Lisbon of Polytechnic Institute of Lisbon and Center of Statistics and Applications of University of Lisbon, Lisbon, Portugal.
BMC Bioinformatics. 2012 Jun 26;13:147. doi: 10.1186/1471-2105-13-147.
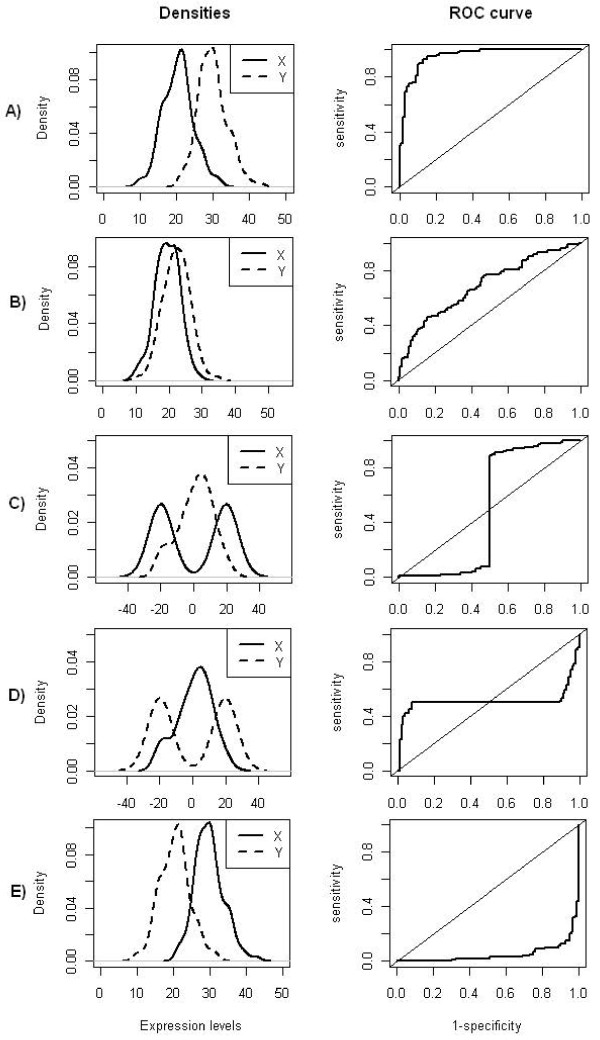
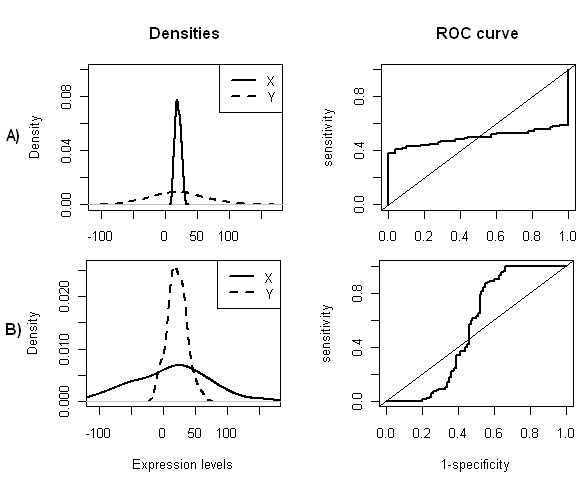
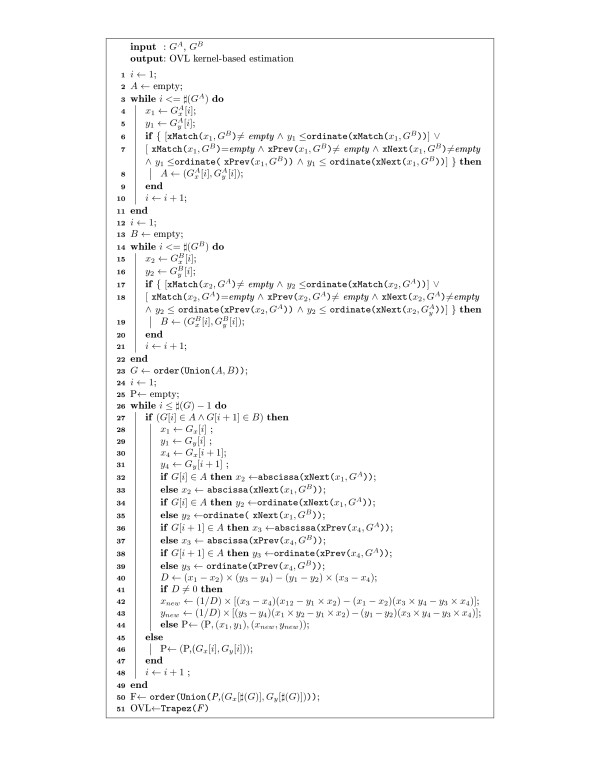
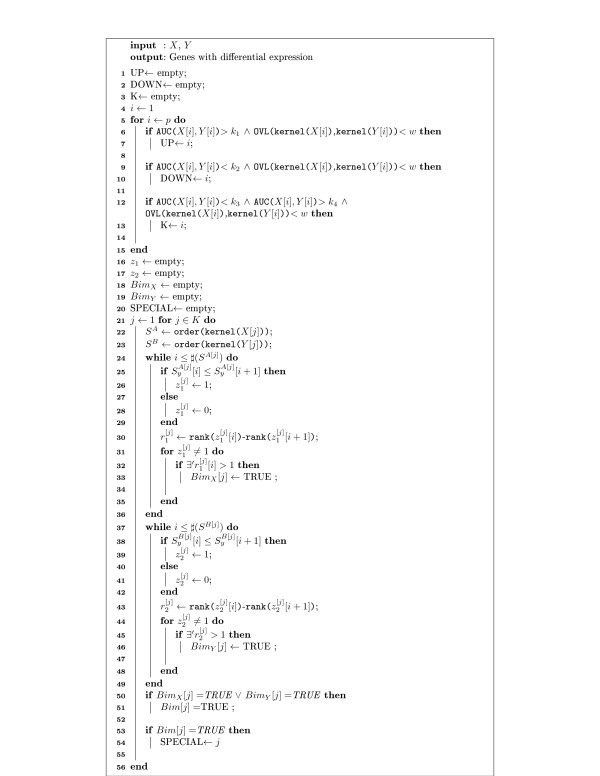
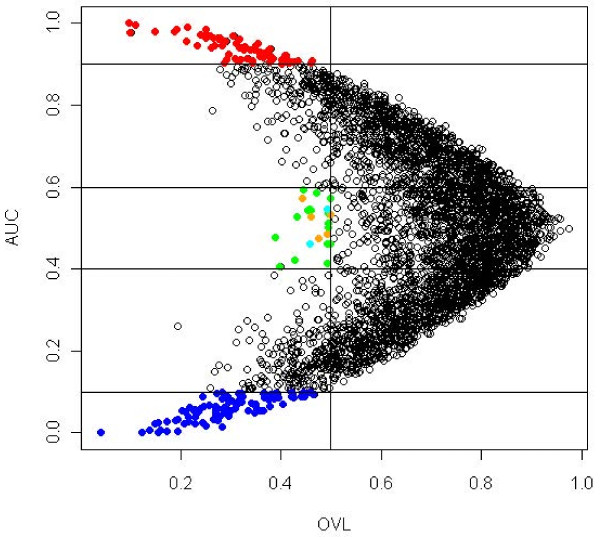
A common task in analyzing microarray data is to determine which genes are differentially expressed across two (or more) kind of tissue samples or samples submitted under experimental conditions. Several statistical methods have been proposed to accomplish this goal, generally based on measures of distance between classes. It is well known that biological samples are heterogeneous because of factors such as molecular subtypes or genetic background that are often unknown to the experimenter. For instance, in experiments which involve molecular classification of tumors it is important to identify significant subtypes of cancer. Bimodal or multimodal distributions often reflect the presence of subsamples mixtures. Consequently, there can be genes differentially expressed on sample subgroups which are missed if usual statistical approaches are used. In this paper we propose a new graphical tool which not only identifies genes with up and down regulations, but also genes with differential expression in different subclasses, that are usually missed if current statistical methods are used. This tool is based on two measures of distance between samples, namely the overlapping coefficient (OVL) between two densities and the area under the receiver operating characteristic (ROC) curve. The methodology proposed here was implemented in the open-source R software.
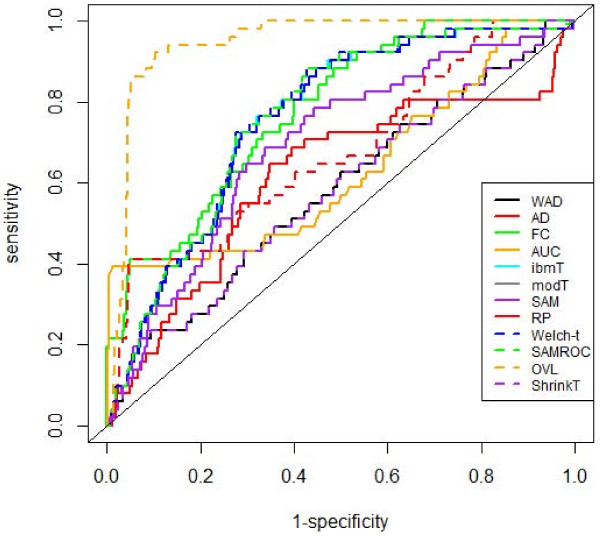
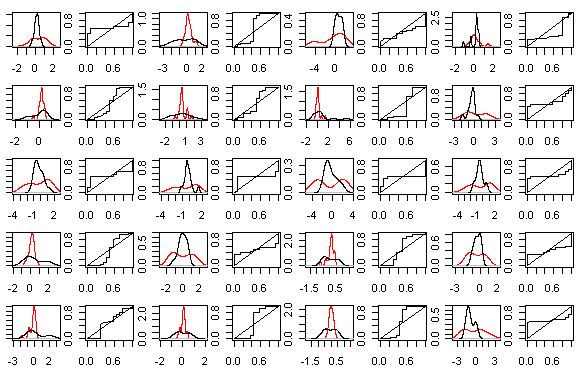
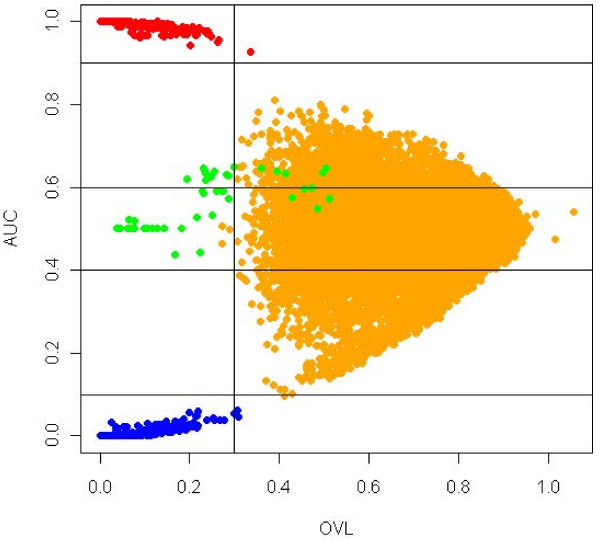
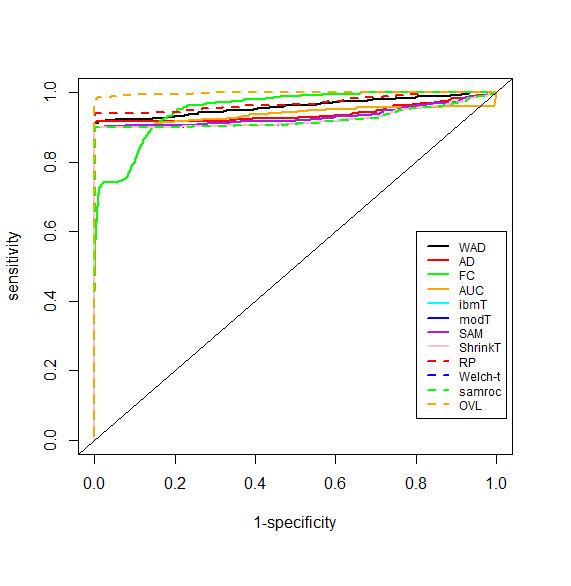
This method was applied to a publicly available dataset, as well as to a simulated dataset. We compared our results with the ones obtained using some of the standard methods for detecting differentially expressed genes, namely Welch t-statistic, fold change (FC), rank products (RP), average difference (AD), weighted average difference (WAD), moderated t-statistic (modT), intensity-based moderated t-statistic (ibmT), significance analysis of microarrays (samT) and area under the ROC curve (AUC). On both datasets all differentially expressed genes with bimodal or multimodal distributions were not selected by all standard selection procedures. We also compared our results with (i) area between ROC curve and rising area (ABCR) and (ii) the test for not proper ROC curves (TNRC). We found our methodology more comprehensive, because it detects both bimodal and multimodal distributions and different variances can be considered on both samples. Another advantage of our method is that we can analyze graphically the behavior of different kinds of differentially expressed genes.
Our results indicate that the arrow plot represents a new flexible and useful tool for the analysis of gene expression profiles from microarrays.
分析微阵列数据的一个常见任务是确定哪些基因在两种(或更多种)组织样本或在实验条件下提交的样本之间差异表达。已经提出了几种统计方法来实现这一目标,这些方法通常基于类之间的距离度量。众所周知,由于分子亚型或遗传背景等因素,生物样本是异质的,而这些因素通常是实验人员所不知道的。例如,在涉及肿瘤分子分类的实验中,识别重要的癌症亚型是很重要的。双峰或多峰分布通常反映了亚样本混合物的存在。因此,如果使用通常的统计方法,可能会错过在样本亚组中差异表达的基因。在本文中,我们提出了一种新的图形工具,该工具不仅可以识别上调和下调的基因,还可以识别通常在使用当前统计方法时会错过的不同亚类中的差异表达基因。该工具基于两个样本之间的距离度量,即两个密度之间的重叠系数(OVL)和接收器操作特性(ROC)曲线下的面积。这里提出的方法是在开源 R 软件中实现的。
该方法应用于一个公开可用的数据集,以及一个模拟数据集。我们将我们的结果与一些用于检测差异表达基因的标准方法的结果进行了比较,这些方法包括 Welch t 统计量、折叠变化(FC)、秩乘积(RP)、平均差异(AD)、加权平均差异(WAD)、适度 t 统计量(modT)、基于强度的适度 t 统计量(ibmT)、微阵列显著性分析(samT)和 ROC 曲线下的面积(AUC)。在两个数据集上,所有具有双峰或多峰分布的差异表达基因都没有被所有标准选择程序选择。我们还将我们的结果与(i)ROC 曲线下面积和上升面积(ABCR)和(ii)ROC 曲线不当检验(TNRC)进行了比较。我们发现我们的方法更全面,因为它可以检测双峰和多峰分布,并且可以考虑两个样本之间的不同方差。我们方法的另一个优点是,我们可以图形化地分析不同类型的差异表达基因的行为。
我们的结果表明,箭头图代表了一种用于分析微阵列基因表达谱的新的灵活而有用的工具。