• 文献检索
  • 文档翻译
  • 深度研究
  • 学术资讯
  • Suppr Zotero 插件Zotero 插件
  • 邀请有礼
  • 套餐&价格
  • 历史记录
应用&插件
Suppr Zotero 插件Zotero 插件浏览器插件Mac 客户端Windows 客户端微信小程序
定价
高级版会员购买积分包购买API积分包
服务
文献检索文档翻译深度研究API 文档MCP 服务
关于我们
关于 Suppr公司介绍联系我们用户协议隐私条款
关注我们

Suppr 超能文献

核心技术专利:CN118964589B侵权必究
粤ICP备2023148730 号-1Suppr @ 2026

文献检索

告别复杂PubMed语法,用中文像聊天一样搜索,搜遍4000万医学文献。AI智能推荐,让科研检索更轻松。

立即免费搜索

文件翻译

保留排版,准确专业,支持PDF/Word/PPT等文件格式,支持 12+语言互译。

免费翻译文档

深度研究

AI帮你快速写综述,25分钟生成高质量综述,智能提取关键信息,辅助科研写作。

立即免费体验

从微阵列数据生成差异表达基因列表的方法的比较与评估

Comparison and evaluation of methods for generating differentially expressed gene lists from microarray data.

作者信息

Jeffery Ian B, Higgins Desmond G, Culhane Aedín C

机构信息

Bioinformatics, Conway Institute, University College Dublin, Belfield, Dublin 4, Ireland.

出版信息

BMC Bioinformatics. 2006 Jul 26;7:359. doi: 10.1186/1471-2105-7-359.

DOI:10.1186/1471-2105-7-359
PMID:16872483
原文链接:https://pmc.ncbi.nlm.nih.gov/articles/PMC1544358/
Abstract

BACKGROUND

Numerous feature selection methods have been applied to the identification of differentially expressed genes in microarray data. These include simple fold change, classical t-statistic and moderated t-statistics. Even though these methods return gene lists that are often dissimilar, few direct comparisons of these exist. We present an empirical study in which we compare some of the most commonly used feature selection methods. We apply these to 9 publicly available datasets, and compare, both the gene lists produced and how these perform in class prediction of test datasets.

RESULTS

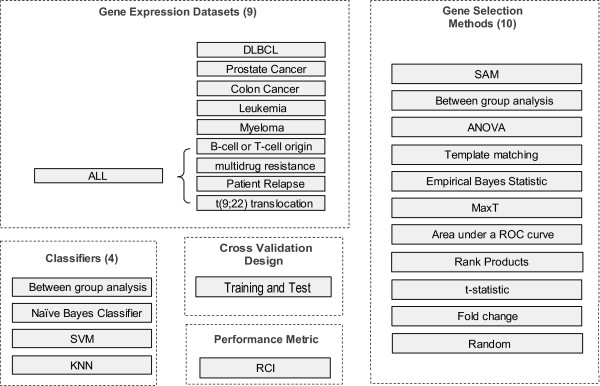
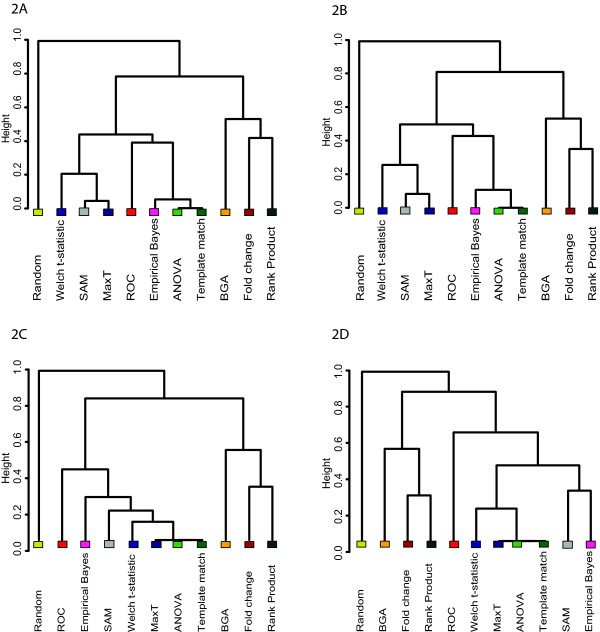
In this study, we compared the efficiency of the feature selection methods; significance analysis of microarrays (SAM), analysis of variance (ANOVA), empirical bayes t-statistic, template matching, maxT, between group analysis (BGA), Area under the receiver operating characteristic (ROC) curve, the Welch t-statistic, fold change, rank products, and sets of randomly selected genes. In each case these methods were applied to 9 different binary (two class) microarray datasets. Firstly we found little agreement in gene lists produced by the different methods. Only 8 to 21% of genes were in common across all 10 feature selection methods. Secondly, we evaluated the class prediction efficiency of each gene list in training and test cross-validation using four supervised classifiers.

CONCLUSION

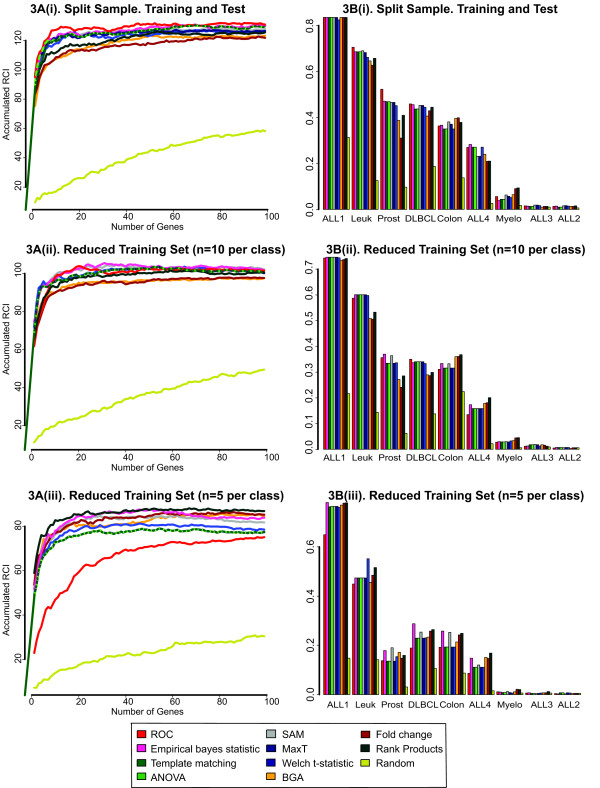
We report that the choice of feature selection method, the number of genes in the genelist, the number of cases (samples) and the noise in the dataset, substantially influence classification success. Recommendations are made for choice of feature selection. Area under a ROC curve performed well with datasets that had low levels of noise and large sample size. Rank products performs well when datasets had low numbers of samples or high levels of noise. The Empirical bayes t-statistic performed well across a range of sample sizes.

摘要

背景

众多特征选择方法已应用于识别微阵列数据中差异表达的基因。这些方法包括简单的倍数变化、经典t检验统计量和经验贝叶斯t检验统计量。尽管这些方法返回的基因列表通常不同,但很少有对它们的直接比较。我们进行了一项实证研究,比较了一些最常用的特征选择方法。我们将这些方法应用于9个公开可用的数据集,并比较生成的基因列表以及它们在测试数据集的类别预测中的表现。

结果

在本研究中,我们比较了特征选择方法的效率;微阵列显著性分析(SAM)、方差分析(ANOVA)、经验贝叶斯t检验统计量、模板匹配、最大T值、组间分析(BGA)、受试者操作特征(ROC)曲线下面积、韦尔奇t检验统计量、倍数变化、秩乘积以及随机选择的基因集。在每种情况下,这些方法都应用于9个不同的二元(两类)微阵列数据集。首先,我们发现不同方法生成的基因列表之间几乎没有一致性。在所有10种特征选择方法中,只有8%至21%的基因是相同的。其次,我们使用四个监督分类器评估了每个基因列表在训练和测试交叉验证中的类别预测效率。

结论

我们报告说,特征选择方法的选择、基因列表中的基因数量、样本数量以及数据集中的噪声,对分类成功有重大影响。针对特征选择的选择提出了建议。ROC曲线下面积在噪声水平低且样本量大的数据集上表现良好。当数据集样本数量少或噪声水平高时,秩乘积表现良好。经验贝叶斯t检验统计量在一系列样本量下表现良好。

https://cdn.ncbi.nlm.nih.gov/pmc/blobs/ae1a/1544358/e32db7272cf0/1471-2105-7-359-3.jpg
https://cdn.ncbi.nlm.nih.gov/pmc/blobs/ae1a/1544358/67dc4e04dde2/1471-2105-7-359-1.jpg
https://cdn.ncbi.nlm.nih.gov/pmc/blobs/ae1a/1544358/fa73017a6965/1471-2105-7-359-2.jpg
https://cdn.ncbi.nlm.nih.gov/pmc/blobs/ae1a/1544358/e32db7272cf0/1471-2105-7-359-3.jpg
https://cdn.ncbi.nlm.nih.gov/pmc/blobs/ae1a/1544358/67dc4e04dde2/1471-2105-7-359-1.jpg
https://cdn.ncbi.nlm.nih.gov/pmc/blobs/ae1a/1544358/fa73017a6965/1471-2105-7-359-2.jpg
https://cdn.ncbi.nlm.nih.gov/pmc/blobs/ae1a/1544358/e32db7272cf0/1471-2105-7-359-3.jpg

相似文献

1
Comparison and evaluation of methods for generating differentially expressed gene lists from microarray data.从微阵列数据生成差异表达基因列表的方法的比较与评估
BMC Bioinformatics. 2006 Jul 26;7:359. doi: 10.1186/1471-2105-7-359.
2
Arrow plot: a new graphical tool for selecting up and down regulated genes and genes differentially expressed on sample subgroups.箭头图:一种新的图形工具,用于选择上调和下调的基因以及在样本亚组中差异表达的基因。
BMC Bioinformatics. 2012 Jun 26;13:147. doi: 10.1186/1471-2105-13-147.
3
A comparative study of different machine learning methods on microarray gene expression data.不同机器学习方法对微阵列基因表达数据的比较研究。
BMC Genomics. 2008;9 Suppl 1(Suppl 1):S13. doi: 10.1186/1471-2164-9-S1-S13.
4
Prediction potential of candidate biomarker sets identified and validated on gene expression data from multiple datasets.在来自多个数据集的基因表达数据上鉴定和验证的候选生物标志物集的预测潜力。
BMC Bioinformatics. 2007 Oct 26;8:415. doi: 10.1186/1471-2105-8-415.
5
A unified framework for finding differentially expressed genes from microarray experiments.一种从微阵列实验中寻找差异表达基因的统一框架。
BMC Bioinformatics. 2007 Sep 18;8:347. doi: 10.1186/1471-2105-8-347.
6
Feature selection and classification for microarray data analysis: evolutionary methods for identifying predictive genes.用于微阵列数据分析的特征选择与分类:识别预测基因的进化方法
BMC Bioinformatics. 2005 Jun 15;6:148. doi: 10.1186/1471-2105-6-148.
7
Hierarchical gene selection and genetic fuzzy system for cancer microarray data classification.用于癌症微阵列数据分类的分层基因选择与遗传模糊系统
PLoS One. 2015 Mar 30;10(3):e0120364. doi: 10.1371/journal.pone.0120364. eCollection 2015.
8
Differential prioritization between relevance and redundancy in correlation-based feature selection techniques for multiclass gene expression data.基于相关性的多类基因表达数据特征选择技术中相关性与冗余性之间的差异优先级排序
BMC Bioinformatics. 2006 Jun 23;7:320. doi: 10.1186/1471-2105-7-320.
9
Feature selection and nearest centroid classification for protein mass spectrometry.蛋白质质谱的特征选择与最近质心分类
BMC Bioinformatics. 2005 Mar 23;6:68. doi: 10.1186/1471-2105-6-68.
10
The feature selection bias problem in relation to high-dimensional gene data.与高维基因数据相关的特征选择偏差问题。
Artif Intell Med. 2016 Jan;66:63-71. doi: 10.1016/j.artmed.2015.11.001. Epub 2015 Nov 14.

引用本文的文献

1
Exploring Feature Selection with Deep Learning for Kidney Tissue Microarray Classification Using Infrared Spectral Imaging.利用深度学习进行特征选择以通过红外光谱成像对肾组织微阵列进行分类
Bioengineering (Basel). 2025 Mar 31;12(4):366. doi: 10.3390/bioengineering12040366.
2
Gene expression analysis reveals mir-29 as a linker regulatory molecule among rheumatoid arthritis, inflammatory bowel disease, and dementia: Insights from systems biology approach.基因表达分析揭示mir-29作为类风湿性关节炎、炎症性肠病和痴呆症之间的连接调节分子:来自系统生物学方法的见解。
PLoS One. 2025 Jan 15;20(1):e0316584. doi: 10.1371/journal.pone.0316584. eCollection 2025.
3

本文引用的文献

1
Linear models and empirical bayes methods for assessing differential expression in microarray experiments.用于评估微阵列实验中差异表达的线性模型和经验贝叶斯方法。
Stat Appl Genet Mol Biol. 2004;3:Article3. doi: 10.2202/1544-6115.1027. Epub 2004 Feb 12.
2
Rank-based methods as a non-parametric alternative of the T-statistic for the analysis of biological microarray data.基于秩的方法作为用于生物微阵列数据分析的T统计量的非参数替代方法。
J Bioinform Comput Biol. 2005 Oct;3(5):1171-89. doi: 10.1142/s0219720005001442.
3
Data-adaptive test statistics for microarray data.
Enhancing Transcriptomic Insights into Neurological Disorders Through the Comparative Analysis of Shapley Values.
通过夏普利值的比较分析增强对神经系统疾病的转录组学洞察
Curr Issues Mol Biol. 2024 Nov 29;46(12):13583-13606. doi: 10.3390/cimb46120812.
4
Comparative Analysis of Shapley Values Enhances Transcriptomics Insights across Some Common Uterine Pathologies.比较 Shapley 值分析增强了一些常见子宫病变的转录组学研究结果。
Genes (Basel). 2024 Jun 1;15(6):723. doi: 10.3390/genes15060723.
5
Transcriptomic characterization of Trichoderma harzianum T34 primed tomato plants: assessment of biocontrol agent induced host specific gene expression and plant growth promotion.转录组学分析哈茨木霉 T34 诱导的番茄植株:生物防治剂诱导的宿主特异性基因表达和植物生长促进的评估。
BMC Plant Biol. 2023 Nov 8;23(1):552. doi: 10.1186/s12870-023-04502-6.
6
Adjustment of -value expression to ontology using machine learning for genetic prediction, prioritization, interaction, and its validation in glomerular disease.利用机器学习对肾小球疾病中的基因预测、优先级排序、相互作用及其验证进行-值表达与本体的调整。
Front Genet. 2023 Oct 12;14:1215232. doi: 10.3389/fgene.2023.1215232. eCollection 2023.
7
Benchmarking tools for detecting longitudinal differential expression in proteomics data allows establishing a robust reproducibility optimization regression approach.蛋白质组学数据中纵向差异表达检测的基准工具可用于建立稳健的可重现性优化回归方法。
Nat Commun. 2022 Dec 22;13(1):7877. doi: 10.1038/s41467-022-35564-z.
8
Biomarker interaction selection and disease detection based on multivariate gain ratio.基于多元增益比的生物标志物相互作用选择和疾病检测。
BMC Bioinformatics. 2022 May 12;23(1):176. doi: 10.1186/s12859-022-04699-7.
9
Gill and Liver Transcript Expression Changes Associated With Gill Damage in Atlantic Salmon ().与大西洋鲑鱼()鳃损伤相关的鳃和肝转录表达变化。
Front Immunol. 2022 Mar 28;13:806484. doi: 10.3389/fimmu.2022.806484. eCollection 2022.
10
Multi-omics network characterization reveals novel microRNA biomarkers and mechanisms for diagnosis and subtyping of kidney transplant rejection.多组学网络特征分析揭示了新型 miRNA 生物标志物及其在肾移植排斥诊断和分型中的作用机制。
J Transl Med. 2021 Aug 13;19(1):346. doi: 10.1186/s12967-021-03025-8.
用于微阵列数据的数据自适应检验统计量。
Bioinformatics. 2005 Sep 1;21 Suppl 2:ii108-14. doi: 10.1093/bioinformatics/bti1119.
4
MADE4: an R package for multivariate analysis of gene expression data.MADE4:一个用于基因表达数据多变量分析的R软件包。
Bioinformatics. 2005 Jun 1;21(11):2789-90. doi: 10.1093/bioinformatics/bti394. Epub 2005 Mar 29.
5
Microarray-based gene expression profiling of hematologic malignancies: basic concepts and clinical applications.基于微阵列的血液系统恶性肿瘤基因表达谱分析:基本概念与临床应用
Blood Rev. 2005 Jul;19(4):223-34. doi: 10.1016/j.blre.2004.11.003. Epub 2004 Dec 8.
6
Preferred analysis methods for Affymetrix GeneChips revealed by a wholly defined control dataset.由完全定义的对照数据集揭示的Affymetrix基因芯片的首选分析方法。
Genome Biol. 2005;6(2):R16. doi: 10.1186/gb-2005-6-2-r16. Epub 2005 Jan 28.
7
Differential gene expression detection using penalized linear regression models: the improved SAM statistics.使用惩罚线性回归模型进行差异基因表达检测:改进的SAM统计量
Bioinformatics. 2005 Apr 15;21(8):1565-71. doi: 10.1093/bioinformatics/bti217. Epub 2004 Dec 14.
8
Significance analysis of ROC indices for comparing diagnostic markers: applications to gene microarray data.用于比较诊断标志物的ROC指标的显著性分析:在基因微阵列数据中的应用
J Biopharm Stat. 2004 Nov;14(4):985-1003. doi: 10.1081/BIP-200035475.
9
Rank Difference Analysis of Microarrays (RDAM), a novel approach to statistical analysis of microarray expression profiling data.微阵列秩差异分析(RDAM),一种用于微阵列表达谱数据统计分析的新方法。
BMC Bioinformatics. 2004 Oct 11;5:148. doi: 10.1186/1471-2105-5-148.
10
Bioconductor: open software development for computational biology and bioinformatics.生物导体:用于计算生物学和生物信息学的开源软件开发。
Genome Biol. 2004;5(10):R80. doi: 10.1186/gb-2004-5-10-r80. Epub 2004 Sep 15.