• 文献检索
  • 文档翻译
  • 深度研究
  • 学术资讯
  • Suppr Zotero 插件Zotero 插件
  • 邀请有礼
  • 套餐&价格
  • 历史记录
应用&插件
Suppr Zotero 插件Zotero 插件浏览器插件Mac 客户端Windows 客户端微信小程序
定价
高级版会员购买积分包购买API积分包
服务
文献检索文档翻译深度研究API 文档MCP 服务
关于我们
关于 Suppr公司介绍联系我们用户协议隐私条款
关注我们

Suppr 超能文献

核心技术专利:CN118964589B侵权必究
粤ICP备2023148730 号-1Suppr @ 2026

文献检索

告别复杂PubMed语法,用中文像聊天一样搜索,搜遍4000万医学文献。AI智能推荐,让科研检索更轻松。

立即免费搜索

文件翻译

保留排版,准确专业,支持PDF/Word/PPT等文件格式,支持 12+语言互译。

免费翻译文档

深度研究

AI帮你快速写综述,25分钟生成高质量综述,智能提取关键信息,辅助科研写作。

立即免费体验

利用遥感和 GIS 分析香港地区的空气悬浮颗粒物 (PM2.5)。

Analysis of airborne particulate matter (PM2.5) over Hong Kong using remote sensing and GIS.

机构信息

Joint Laboratory on Geo-Spatial Information Science, The Hong Kong Polytechnic University, Hong Kong, China.

出版信息

Sensors (Basel). 2012;12(6):6825-36. doi: 10.3390/s120606825. Epub 2012 May 25.

DOI:10.3390/s120606825
PMID:22969323
原文链接:https://pmc.ncbi.nlm.nih.gov/articles/PMC3435953/
Abstract

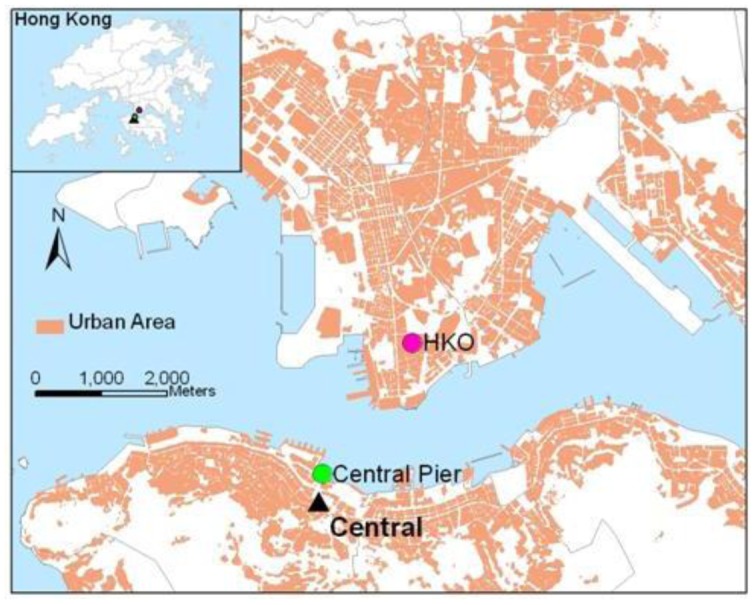
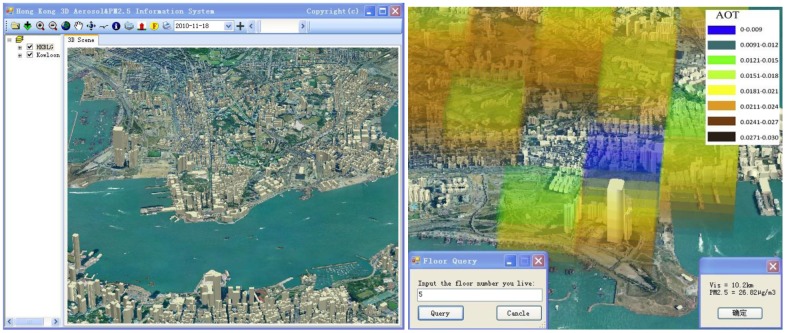
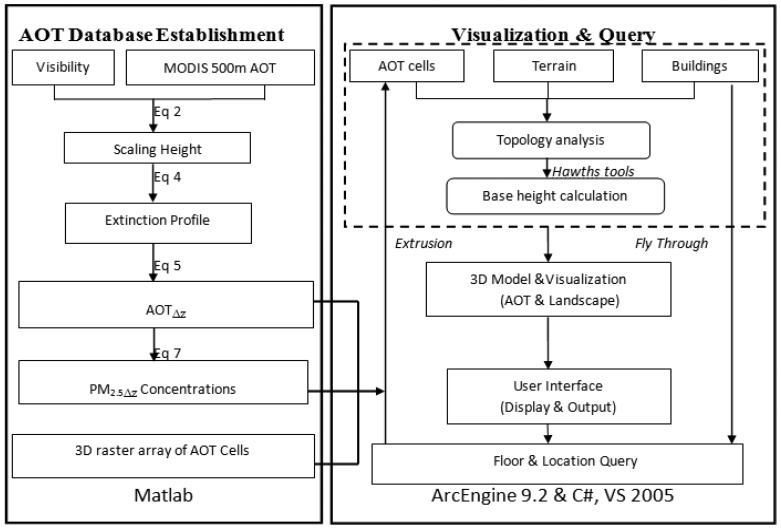
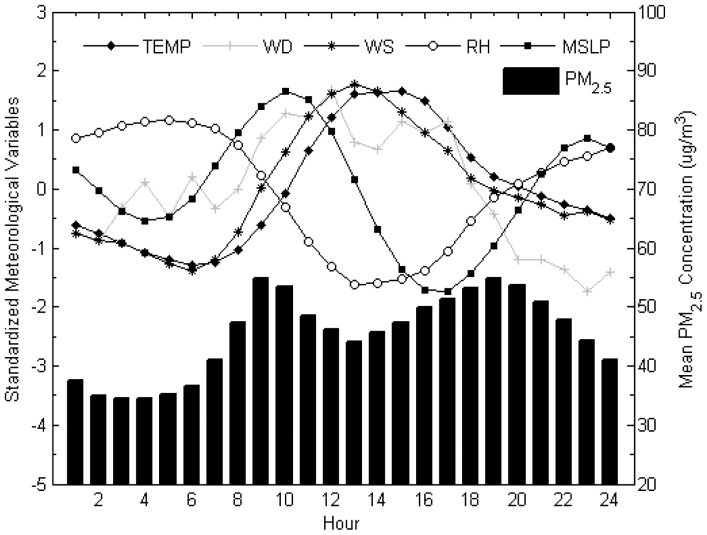
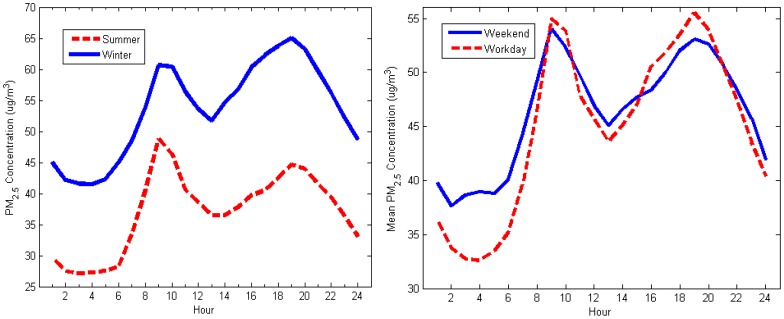
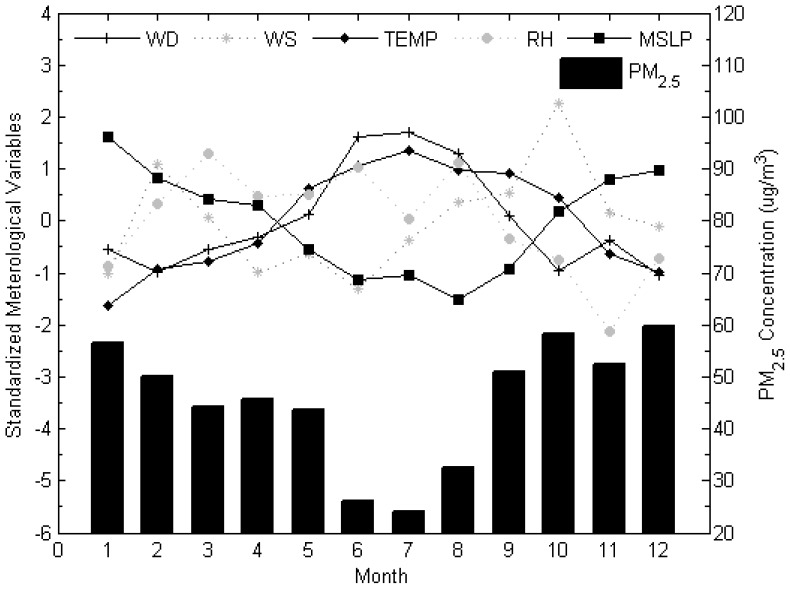
Airborne fine particulates (PM(2.5); particulate matter with diameter less than 2.5 μm) are receiving increasing attention for their potential toxicities and roles in visibility and health. In this study, we interpreted the behavior of PM(2.5) and its correlation with meteorological parameters in Hong Kong, during 2007-2008. Significant diurnal variations of PM(2.5) concentrations were observed and showed a distinctive bimodal pattern with two marked peaks during the morning and evening rush hour times, due to dense traffic. The study observed higher PM(2.5) concentrations in winter when the northerly and northeasterly winds bring pollutants from the Chinese mainland, whereas southerly monsoon winds from the sea bring fresh air to the city in summer. In addition, higher concentrations of PM(2.5) were observed in rush hours on weekdays compared to weekends, suggesting the influence of anthropogenic activities on fine particulate levels, e.g., traffic-related local PM(2.5) emissions. To understand the spatial pattern of PM(2.5) concentrations in the context of the built-up environment of Hong Kong, we utilized MODerate Resolution Imaging Spectroradiometer (MODIS) Aerosol Optical Thickness (AOT) 500 m data and visibility data to derive aerosol extinction profile, then converted to aerosol and PM(2.5) vertical profiles. A Geographic Information Systems (GIS) prototype was developed to integrate atmospheric PM(2.5) vertical profiles with 3D GIS data. An example of the query function in GIS prototype is given. The resulting 3D database of PM(2.5) concentrations provides crucial information to air quality regulators and decision makers to comply with air quality standards and in devising control strategies.

摘要

空气中的细颗粒物(PM(2.5);直径小于 2.5μm 的颗粒物)因其潜在毒性及其在能见度和健康方面的作用而受到越来越多的关注。本研究旨在解释香港地区 2007-2008 年期间细颗粒物(PM(2.5))的行为及其与气象参数的相关性。研究发现,PM(2.5)浓度存在明显的日变化,呈现出早晚高峰时段双峰模式,这是由于交通密集导致的。研究还发现,冬季受北风和东北风影响,中国大陆的污染物会带来更高的 PM(2.5)浓度,而夏季南风则会从海上带来新鲜空气。此外,工作日早晚高峰的 PM(2.5)浓度高于周末,这表明人为活动对细颗粒物水平的影响,例如与交通有关的本地 PM(2.5)排放。为了了解香港建成环境中 PM(2.5)浓度的空间分布模式,我们利用 MODerate Resolution Imaging Spectroradiometer (MODIS) 气溶胶光学厚度(AOT)500m 数据和能见度数据来推导出气溶胶消光廓线,然后将其转换为气溶胶和 PM(2.5)垂直廓线。开发了一个地理信息系统(GIS)原型,将大气 PM(2.5)垂直廓线与 3D GIS 数据集成。给出了 GIS 原型中查询功能的一个示例。生成的 PM(2.5)浓度 3D 数据库为空气质量监管机构和决策者提供了重要信息,以遵守空气质量标准并制定控制策略。

https://cdn.ncbi.nlm.nih.gov/pmc/blobs/2296/3435953/6a4f5eed9584/sensors-12-06825f6.jpg
https://cdn.ncbi.nlm.nih.gov/pmc/blobs/2296/3435953/e8e1b15424e2/sensors-12-06825f1.jpg
https://cdn.ncbi.nlm.nih.gov/pmc/blobs/2296/3435953/cac8e7cb2589/sensors-12-06825f2.jpg
https://cdn.ncbi.nlm.nih.gov/pmc/blobs/2296/3435953/597737d96f4a/sensors-12-06825f3.jpg
https://cdn.ncbi.nlm.nih.gov/pmc/blobs/2296/3435953/a4928db23276/sensors-12-06825f4.jpg
https://cdn.ncbi.nlm.nih.gov/pmc/blobs/2296/3435953/000e41d463fa/sensors-12-06825f5.jpg
https://cdn.ncbi.nlm.nih.gov/pmc/blobs/2296/3435953/6a4f5eed9584/sensors-12-06825f6.jpg

相似文献

1
Analysis of airborne particulate matter (PM2.5) over Hong Kong using remote sensing and GIS.利用遥感和 GIS 分析香港地区的空气悬浮颗粒物 (PM2.5)。
Sensors (Basel). 2012;12(6):6825-36. doi: 10.3390/s120606825. Epub 2012 May 25.
2
Assessment and statistical modeling of the relationship between remotely sensed aerosol optical depth and PM2.5 in the eastern United States.美国东部地区遥感气溶胶光学厚度与PM2.5之间关系的评估及统计建模
Res Rep Health Eff Inst. 2012 May(167):5-83; discussion 85-91.
3
Modeling of Aerosol Vertical Profiles Using GIS and Remote Sensing.利用 GIS 和遥感技术对气溶胶垂直廓线进行建模。
Sensors (Basel). 2009;9(6):4380-9. doi: 10.3390/s90604380. Epub 2009 Jun 4.
4
The relationship between aerosol particles chemical composition and optical properties to identify the biomass burning contribution to fine particles concentration: a case study for São Paulo city, Brazil.气溶胶颗粒化学成分与光学特性之间的关系,以确定生物质燃烧对细颗粒浓度的贡献:巴西圣保罗市的案例研究
Environ Monit Assess. 2016 Dec;189(1):6. doi: 10.1007/s10661-016-5659-7. Epub 2016 Dec 5.
5
The relationships between surface-column aerosol concentrations and meteorological factors observed at major cities in the Yangtze River Delta, China.中国长三角主要城市地表-柱气溶胶浓度与气象因素的关系。
Environ Sci Pollut Res Int. 2019 Dec;26(36):36568-36588. doi: 10.1007/s11356-019-06730-6. Epub 2019 Nov 15.
6
Evaluating heterogeneity in indoor and outdoor air pollution using land-use regression and constrained factor analysis.利用土地利用回归和约束因子分析评估室内和室外空气污染的异质性。
Res Rep Health Eff Inst. 2010 Dec(152):5-80; discussion 81-91.
7
Spatial and Temporal Variation of Atmospheric Particulate Matter in Bangalore: A Technology-Intensive Region in India.班加罗尔大气颗粒物的时空变化:印度一个技术密集型地区。
Arch Environ Contam Toxicol. 2019 Aug;77(2):214-222. doi: 10.1007/s00244-019-00643-8. Epub 2019 Jun 5.
8
Spatial Patterns in Rush-Hour vs. Work-Week Diesel-Related Pollution across a Downtown Core.高峰时段与工作周期间市中心区柴油机相关污染的空间格局。
Int J Environ Res Public Health. 2018 Sep 10;15(9):1968. doi: 10.3390/ijerph15091968.
9
Impact of meteorological parameters on the development of fine and coarse particles over Delhi.气象参数对德里地区细颗粒物和粗颗粒物发展的影响。
Sci Total Environ. 2014 Apr 15;478:175-83. doi: 10.1016/j.scitotenv.2014.01.101. Epub 2014 Feb 12.
10
Application of positive matrix factorization in characterization of PM(10) and PM(2.5) emission sources at urban roadside.正矩阵因子分析在城市路边 PM(10)和 PM(2.5)排放源特征描述中的应用。
Chemosphere. 2012 Jun;88(1):120-30. doi: 10.1016/j.chemosphere.2012.02.083. Epub 2012 Mar 31.

引用本文的文献

1
Field assessment of the effects of land-cover type and pattern on PM and PM concentrations in a microscale environment.微观环境下土地覆盖类型和格局对 PM 和 PM 浓度影响的实地评估。
Environ Sci Pollut Res Int. 2019 Jan;26(3):2314-2327. doi: 10.1007/s11356-018-3697-0. Epub 2018 Nov 21.
2
Zoning of air quality index (PM and PM) by Arc-GIS for Khorramabad city, Iran.利用Arc-GIS对伊朗霍拉马巴德市空气质量指数(PM和PM)进行分区。
Data Brief. 2018 May 19;19:1131-1141. doi: 10.1016/j.dib.2018.05.063. eCollection 2018 Aug.
3
Applications of Space Technologies to Global Health: Scoping Review.

本文引用的文献

1
Modeling of Aerosol Vertical Profiles Using GIS and Remote Sensing.利用 GIS 和遥感技术对气溶胶垂直廓线进行建模。
Sensors (Basel). 2009;9(6):4380-9. doi: 10.3390/s90604380. Epub 2009 Jun 4.
2
Tropospheric aerosol extinction coefficient profiles derived from scanning lidar measurements over Tsukuba, Japan, from 1990 to 1993.1990年至1993年期间,通过对日本筑波进行扫描激光雷达测量得出的对流层气溶胶消光系数剖面。
Appl Opt. 1996 Aug 20;35(24):4941-52. doi: 10.1364/AO.35.004941.
3
Relationships between vertical attenuation and surface meteorological range.
空间技术在全球健康领域的应用:范围综述
J Med Internet Res. 2018 Jun 27;20(6):e230. doi: 10.2196/jmir.9458.
4
Optimisation in the Design of Environmental Sensor Networks with Robustness Consideration.考虑稳健性的环境传感器网络设计优化
Sensors (Basel). 2015 Nov 27;15(12):29765-81. doi: 10.3390/s151229765.
5
Temporal and Spatial Simulation of Atmospheric Pollutant PM2.5 Changes and Risk Assessment of Population Exposure to Pollution Using Optimization Algorithms of the Back Propagation-Artificial Neural Network Model and GIS.利用反向传播人工神经网络模型和地理信息系统的优化算法对大气污染物PM2.5变化进行时空模拟及人群污染暴露风险评估
Int J Environ Res Public Health. 2015 Sep 29;12(10):12171-95. doi: 10.3390/ijerph121012171.
垂直衰减与地面气象视距之间的关系。
Appl Opt. 1970 Aug 1;9(8):1804-10. doi: 10.1364/AO.9.001804.
4
Estimating regional spatial and temporal variability of PM(2.5) concentrations using satellite data, meteorology, and land use information.利用卫星数据、气象学和土地利用信息估算PM(2.5)浓度的区域时空变异性。
Environ Health Perspect. 2009 Jun;117(6):886-92. doi: 10.1289/ehp.0800123. Epub 2009 Jan 28.
5
Coarse particulate matter air pollution and hospital admissions for cardiovascular and respiratory diseases among Medicare patients.医疗保险患者中粗颗粒物空气污染与心血管和呼吸道疾病住院情况
JAMA. 2008 May 14;299(18):2172-9. doi: 10.1001/jama.299.18.2172.
6
The impact of components of fine particulate matter on cardiovascular mortality in susceptible subpopulations.细颗粒物成分对易感亚人群心血管死亡率的影响。
Occup Environ Med. 2008 Nov;65(11):750-6. doi: 10.1136/oem.2007.036673. Epub 2008 Apr 16.
7
Dependence of urban air pollutants on meteorology.城市空气污染物对气象条件的依赖性。
Sci Total Environ. 2005 Nov 1;350(1-3):225-37. doi: 10.1016/j.scitotenv.2005.01.043.
8
The global burden of disease due to outdoor air pollution.室外空气污染所致的全球疾病负担。
J Toxicol Environ Health A. 2005;68(13-14):1301-7. doi: 10.1080/15287390590936166.
9
Seasonal source-receptor relationships in a petrochemical industrial district over northern Taiwan.
J Air Waste Manag Assoc. 2005 Mar;55(3):326-41. doi: 10.1080/10473289.2005.10464625.
10
PM2.5 chemical composition in Hong Kong: urban and regional variations.
Sci Total Environ. 2005 Feb 15;338(3):267-81. doi: 10.1016/j.scitotenv.2004.07.021.