Institute of Social and Preventive Medicine (ISPM), University of Bern, Bern, Switzerland.
PLoS One. 2013;8(2):e57611. doi: 10.1371/journal.pone.0057611. Epub 2013 Feb 28.
Mortality in patients starting antiretroviral therapy (ART) is higher in Malawi and Zambia than in South Africa. We examined whether different monitoring of ART (viral load [VL] in South Africa and CD4 count in Malawi and Zambia) could explain this mortality difference.
Mathematical modelling study based on data from ART programmes.
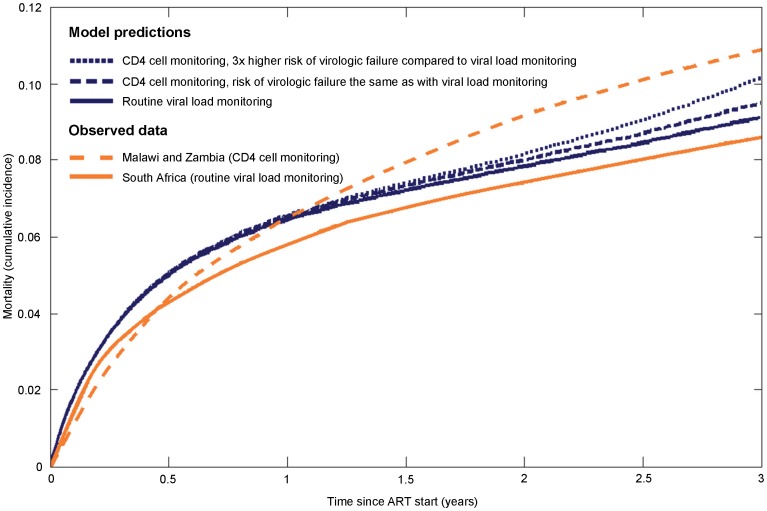
We used a stochastic simulation model to study the effect of VL monitoring on mortality over 5 years. In baseline scenario A all parameters were identical between strategies except for more timely and complete detection of treatment failure with VL monitoring. Additional scenarios introduced delays in switching to second-line ART (scenario B) or higher virologic failure rates (due to worse adherence) when monitoring was based on CD4 counts only (scenario C). Results are presented as relative risks (RR) with 95% prediction intervals and percent of observed mortality difference explained.
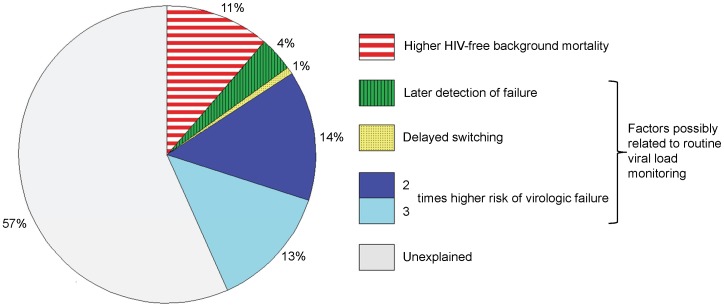
RRs comparing VL with CD4 cell count monitoring were 0.94 (0.74-1.03) in scenario A, 0.94 (0.77-1.02) with delayed switching (scenario B) and 0.80 (0.44-1.07) when assuming a 3-times higher rate of failure (scenario C). The observed mortality at 3 years was 10.9% in Malawi and Zambia and 8.6% in South Africa (absolute difference 2.3%). The percentage of the mortality difference explained by VL monitoring ranged from 4% (scenario A) to 32% (scenarios B and C combined, assuming a 3-times higher failure rate). Eleven percent was explained by non-HIV related mortality.
VL monitoring reduces mortality moderately when assuming improved adherence and decreased failure rates.
在马拉维和赞比亚,开始抗逆转录病毒疗法(ART)的患者死亡率高于南非。我们研究了不同的 ART 监测方法(南非监测病毒载量[VL],马拉维和赞比亚监测 CD4 计数)是否可以解释这种死亡率差异。
基于 ART 项目数据的数学模型研究。
我们使用随机模拟模型研究了 5 年内 VL 监测对死亡率的影响。在基线情景 A 中,所有参数在策略之间都是相同的,除了 VL 监测可以更及时、更完整地检测到治疗失败。在方案 B 中引入了切换到二线 ART 的延迟,或者在仅基于 CD4 计数监测时,由于依从性较差导致病毒学失败率更高(方案 C)。结果以相对风险(RR)和 95%预测区间以及观察到的死亡率差异解释百分比表示。
与 CD4 细胞计数监测相比,VL 监测的 RR 在情景 A 中为 0.94(0.74-1.03),在延迟切换(情景 B)中为 0.94(0.77-1.02),在假设失败率高 3 倍(情景 C)时为 0.80(0.44-1.07)。在马拉维和赞比亚,3 年时的观察死亡率为 10.9%,南非为 8.6%(绝对差异为 2.3%)。VL 监测解释的死亡率差异百分比范围为 4%(情景 A)至 32%(情景 B 和 C 组合,假设失败率高 3 倍)。非 HIV 相关死亡率解释了 11%。
假设依从性提高和失败率降低,VL 监测可适度降低死亡率。