Finnish Museum of Natural History, University of Helsinki, Helsinki, Finland.
PLoS One. 2013 May 1;8(5):e63294. doi: 10.1371/journal.pone.0063294. Print 2013.
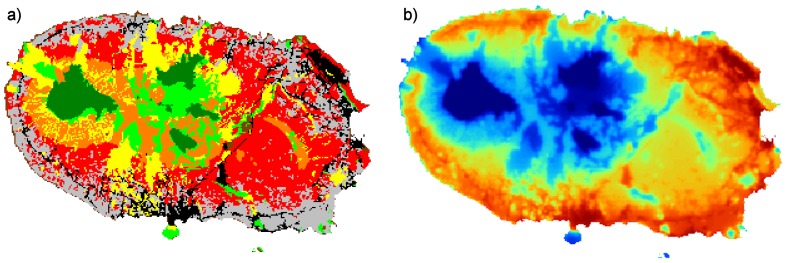
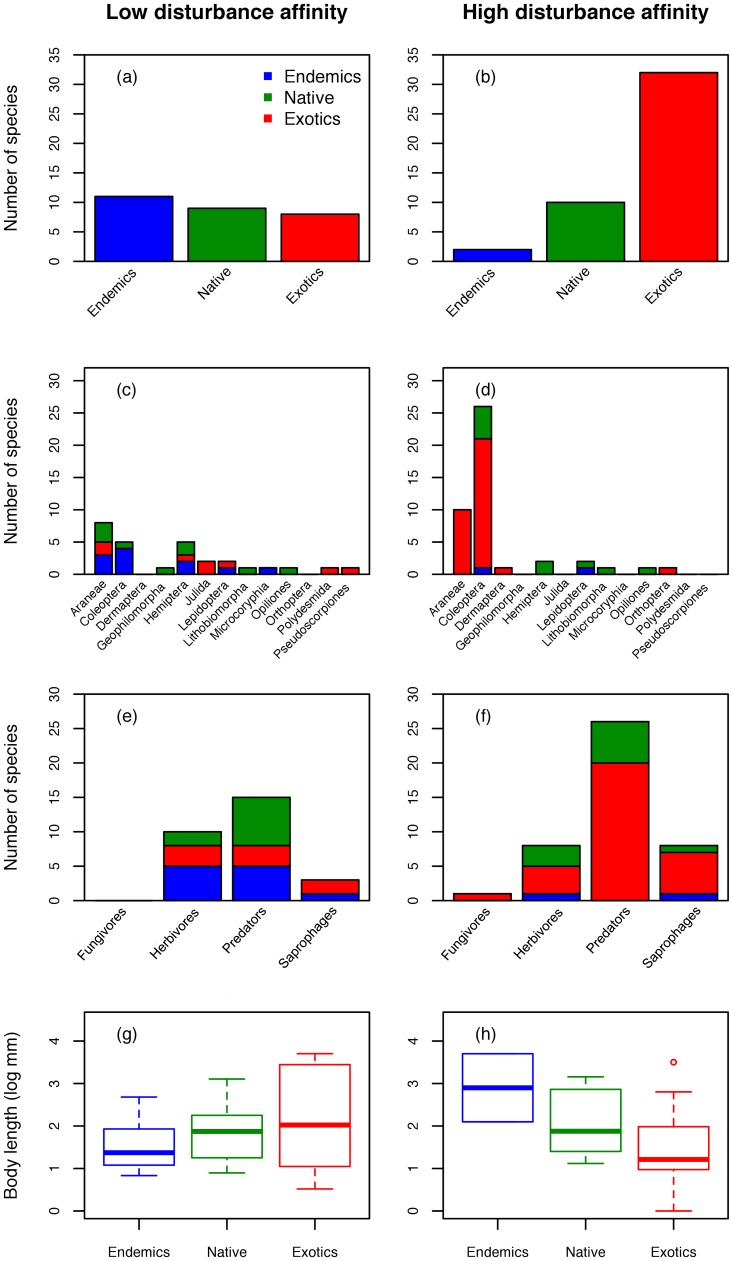
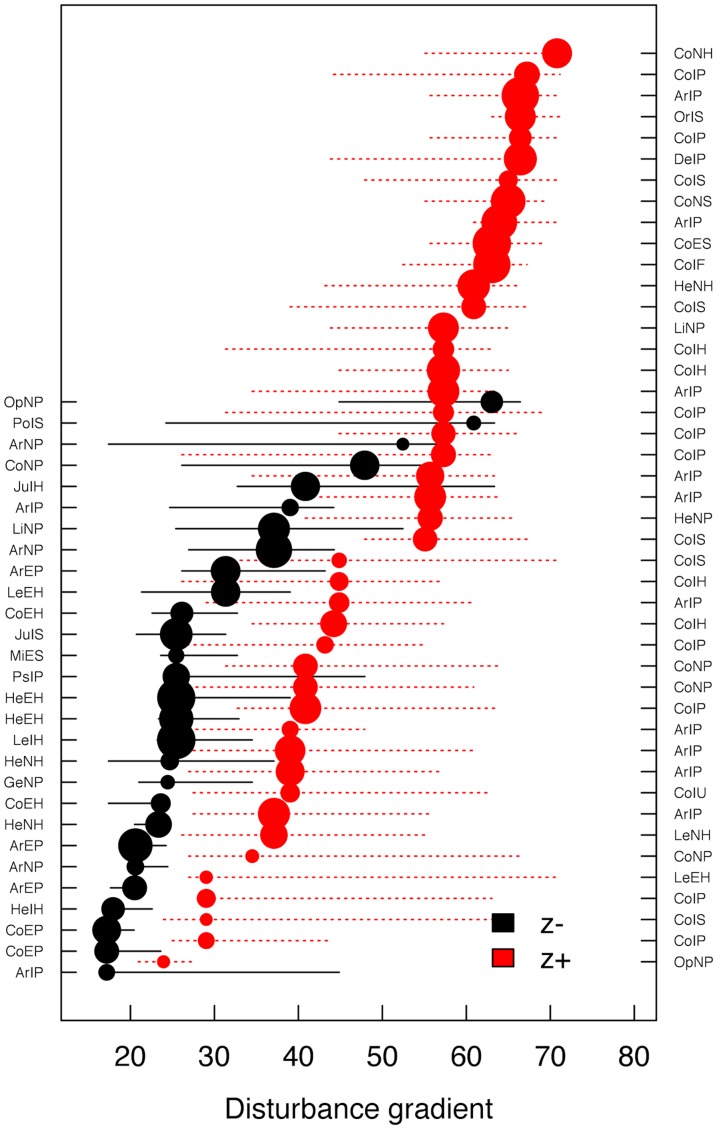
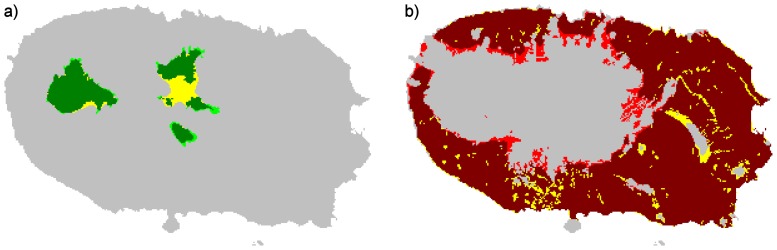
Successful conservation plans are conditioned by our ability to detect anthropogenic change in space and time and various statistical analyses have been developed to handle this critical issue. The main objective of this paper is to illustrate a new approach for spatial analysis in conservation biology. Here, we propose a two-step protocol. First, we introduce a new disturbance metric which provides a continuous measure of disturbance for any focal communities on the basis of the surrounding landscape matrix. Second, we use this new gradient to estimate species and community disturbance thresholds by implementing a recently developed method called Threshold Indicator Taxa ANalysis (TITAN). TITAN detects changes in species distributions along environmental gradients using indicators species analysis and assesses synchrony among species change points as evidence for community thresholds. We demonstrate our method with soil arthropod assemblages along a disturbance gradient in Terceira Island (Azores, Portugal). We show that our new disturbance metric realistically reflects disturbance patterns, especially in buffer zones (ecotones) between land use categories. By estimating species disturbance thresholds with TITAN along the disturbance gradient in Terceira, we show that species significantly associated with low disturbance differ from those associated with high disturbance in their biogeographical origin (endemics, non-endemic natives and exotics) and taxonomy (order). Finally, we suggest that mapping the disturbance community thresholds may reveal areas of primary interest for conservation, since these may host indigenous species sensitive to high disturbance levels. This new framework may be useful when: (1) both local and regional processes are to be reflected on single disturbance measures; (2) these are better quantified in a continuous gradient; (3) mapping disturbance of large regions using fine scales is necessary; (4) indicator species for disturbance are searched for and; (5) community thresholds are useful to understand the global dynamics of habitats.
成功的保护规划取决于我们在时空上检测人为变化的能力,为此已经开发了各种统计分析方法来处理这一关键问题。本文的主要目的是说明保护生物学中空间分析的一种新方法。在这里,我们提出了一个两步方案。首先,我们引入了一种新的干扰度量标准,该标准基于周围景观矩阵为任何焦点群落提供了连续的干扰度量。其次,我们使用这个新的梯度通过实施一种名为阈值指示种分析(TITAN)的新方法来估计物种和群落的干扰阈值。TITAN 使用指示种分析沿环境梯度检测物种分布的变化,并评估物种变化点之间的同步性作为群落阈值的证据。我们在特塞拉岛(亚速尔群岛,葡萄牙)的干扰梯度上用土壤节肢动物组合来证明我们的方法。我们表明,我们的新干扰度量标准真实地反映了干扰模式,特别是在土地利用类别之间的缓冲区(生态交错带)。通过在特塞拉岛的干扰梯度上用 TITAN 估计物种的干扰阈值,我们表明与低干扰显著相关的物种与与高干扰相关的物种在其生物地理起源(特有种、非特有本地种和外来种)和分类(目)上有所不同。最后,我们建议绘制干扰群落阈值图可能会揭示对保护具有主要意义的区域,因为这些区域可能会容纳对高干扰水平敏感的本土物种。当:(1)要在单个干扰措施上反映本地和区域过程;(2)这些过程在连续梯度中更好地量化;(3)需要使用细尺度对大区域进行干扰映射;(4)正在寻找干扰的指示物种;(5)群落阈值有助于理解栖息地的全球动态时,这个新框架可能会很有用。