Protein Data Bank in Europe, EMBL-EBI, Wellcome Trust Genome Campus, Hinxton, Cambridge CB10 1SD, UK.
J Cheminform. 2013 Aug 29;5(1):40. doi: 10.1186/1758-2946-5-40.
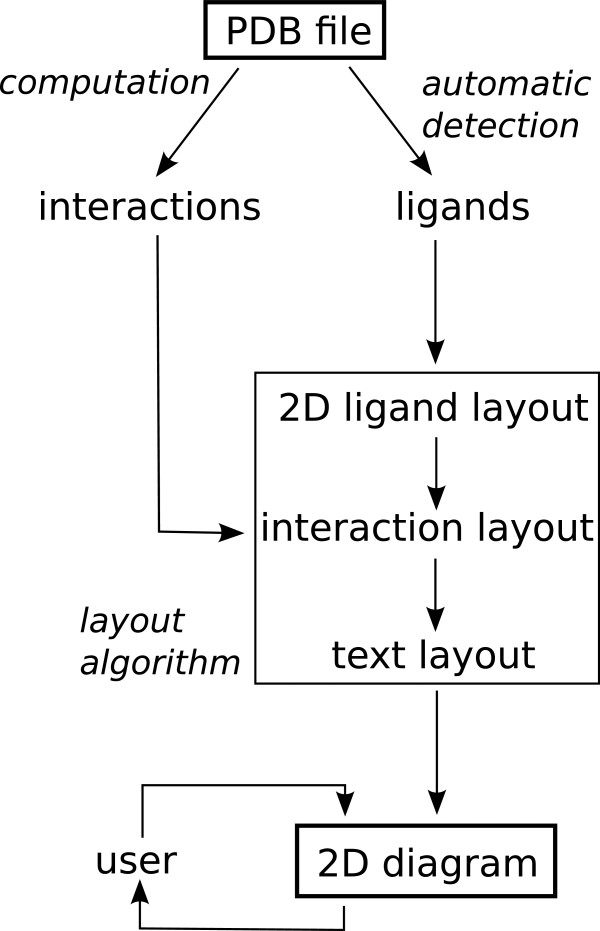
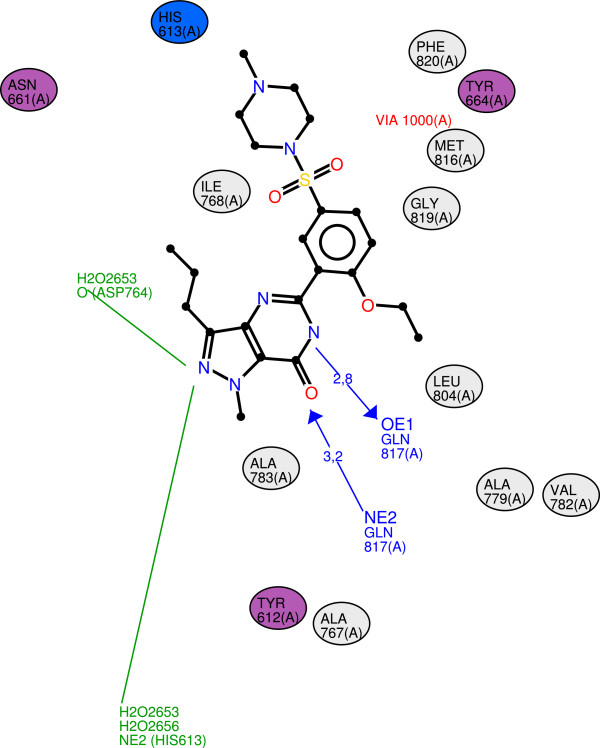
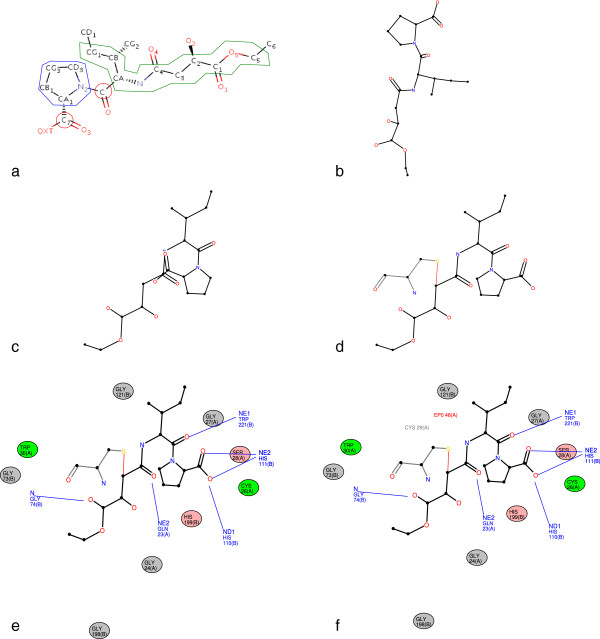
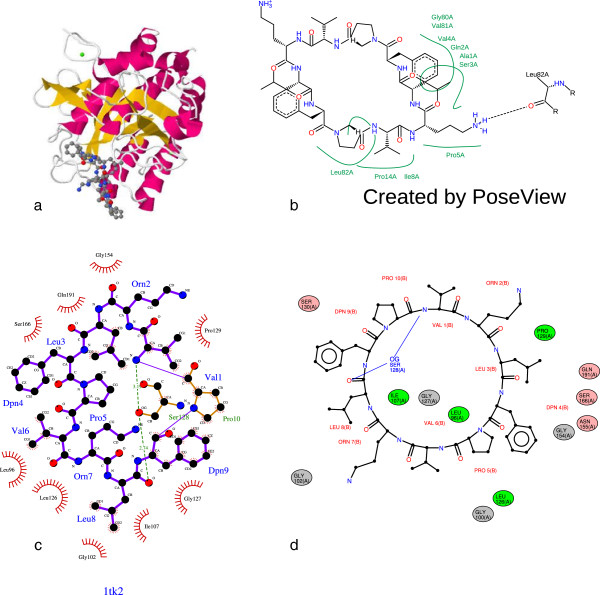
: 2D diagrams are widely used in the scientific literature to represent interactions between ligands and biomacromolecules. Such schematic diagrams are very helpful to better understand the chemical interactions and biological processes in which ligands are involved. Here, a new tool for automatic and interactive generation of 2D diagrams for biomacromolecule/ligand interactions is presented. LeView (Ligand-Environment Viewer) produces customised and high-quality figures, with a good compromise between a faithful representation of the 3D data (structures and interactions) and aesthetic criteria. LeView can be freely downloaded at http://www.pegase-biosciences.com/tools/leview/.
二维图在科学文献中被广泛用于表示配体和生物大分子之间的相互作用。这些示意图有助于更好地理解配体参与的化学相互作用和生物过程。这里介绍了一种用于自动生成和交互生成生物大分子/配体相互作用二维图的新工具。LeView(配体环境查看器)可生成定制的高质量图形,在忠实表示 3D 数据(结构和相互作用)和美学标准之间取得良好的平衡。LeView 可在 http://www.pegase-biosciences.com/tools/leview/ 免费下载。