Astell-Burt Thomas, Feng Xiaoqi, Mavoa Suzanne, Badland Hannah M, Giles-Corti Billie
School of Science and Health, University of Western Sydney, Sydney, Australia.
BMC Public Health. 2014 Mar 31;14:292. doi: 10.1186/1471-2458-14-292.
An inequitable distribution of parks and other 'green spaces' could exacerbate health inequalities if people on lower incomes, who are already at greater risk of preventable diseases, have poorer access.
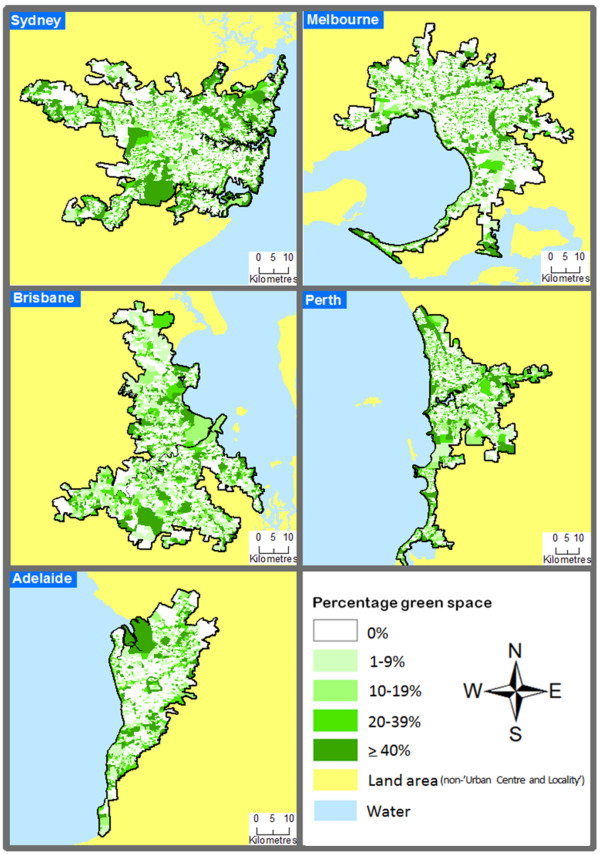
The availability of green space within 1 kilometre of a Statistical Area 1 (SA1) was linked to data from the 2011 Australian census for Sydney (n = 4.6 M residents); Melbourne (n = 4.2 M); Brisbane (n = 2.2 M); Perth (n = 1.8 M); and Adelaide (n = 1.3 M). Socioeconomic circumstances were measured via the percentage population of each SA1 living on < $21,000 per annum. Negative binomial and logit regression models were used to investigate association between the availability of green space in relation to neighbourhood socioeconomic circumstances, adjusting for city and population density.
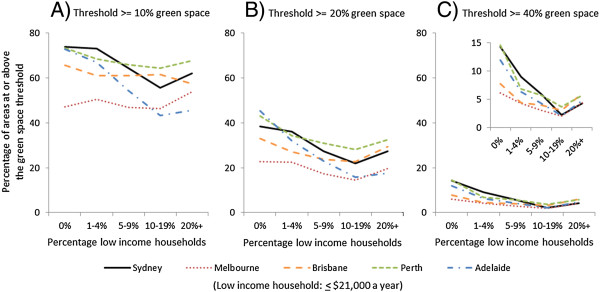
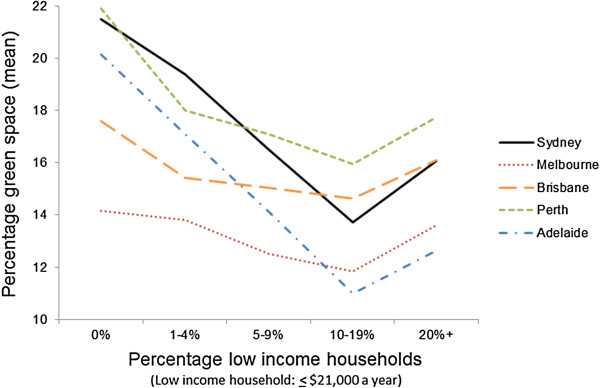
Green space availability was substantively lower in SA1s with a higher percentage of low income residents (e.g. an incidence rate ratio of 0.82 (95% confidence interval (95% CI) 0.75, 0.89) was observed for SA1s containing ≥20% versus 0-1% low income residents). This association varied between cities (p < 0.001). Adelaide reported the least equitable distribution of green space, with approximately 20% greenery in the most affluent areas versus 12% availability in the least affluent. Although Melbourne had a smaller proportion of SA1s in the top quintile of green space availability (13.8%), the distribution of greenery was the most equitable of all the cities, with only a 0.5% difference in the availability of green space between SA1s containing 0-1% low income households versus those with ≥20%. Inequity of access, however, was reported across all cities when using logit regression to examine the availability of at least 20% (odds ratio 0.74, 95% CI 0.59, 0.93) or 40% (0.45, 0.29, 0.69) green space availability in the more disadvantaged versus affluent neighbourhoods.
Affirmative action on green space planning is required to redress the socioeconomic inequity of access to this important public health resource.
如果收入较低的人群(他们患可预防疾病的风险本就更高)获得公园及其他“绿地”的机会较差,那么公园和其他“绿地”分布不均可能会加剧健康不平等。
将统计区1(SA1)周边1公里范围内的绿地可及性与2011年悉尼(n = 460万居民)、墨尔本(n = 420万)、布里斯班(n = 220万)、珀斯(n = 180万)和阿德莱德(n = 130万)的澳大利亚人口普查数据相关联。通过每个SA1中每年收入低于21,000澳元的人口百分比来衡量社会经济状况。使用负二项式和逻辑回归模型来研究绿地可及性与邻里社会经济状况之间的关联,并对城市和人口密度进行调整。
低收入居民百分比更高的SA1中,绿地可及性显著更低(例如,对于低收入居民占比≥20%的SA1与占比0 - 1%的SA1,观察到的发病率比为0.82(95%置信区间(95%CI)0.75, 0.89))。这种关联在不同城市之间有所不同(p < 0.001)。阿德莱德报告的绿地分布最不公平,最富裕地区的绿化率约为20%,而最贫困地区为12%。尽管墨尔本在绿地可及性最高的五分位数中的SA1比例较小(13.8%),但在所有城市中,绿地分布最为公平,低收入家庭占比0 - 1%的SA1与占比≥20%的SA1之间的绿地可及性差异仅为0.5%。然而,当使用逻辑回归来研究处境更不利地区与富裕地区至少20%(优势比0.74,95%CI 0.59, 0.93)或40%(0.45, 0.29, 0.69)绿地可及性时,所有城市均报告了可及性的不平等。
需要在绿地规划方面采取积极行动,以纠正获取这一重要公共卫生资源方面的社会经济不平等现象。