Huang Jiun-Chi, Wei Shu-Yi, Chen Szu-Chia, Chang Jer-Ming, Hung Chi-Chih, Su Ho-Ming, Hwang Shang-Jyh, Chen Hung-Chun
Division of Nephrology, Department of Internal Medicine, Kaohsiung Medical University Hospital, Kaohsiung Medical University, Kaohsiung, Taiwan; Department of Internal Medicine, Kaohsiung Municipal Hsiao-Kang Hospital, Kaohsiung Medical University, Kaohsiung, Taiwan.
Department of Internal Medicine, Kaohsiung Municipal United Hospital, Kaohsiung, Taiwan; Yuh-Ing Junior College of Health Care & Management, Kaohsiung, Taiwan.
PLoS One. 2014 Jul 9;9(7):e101962. doi: 10.1371/journal.pone.0101962. eCollection 2014.
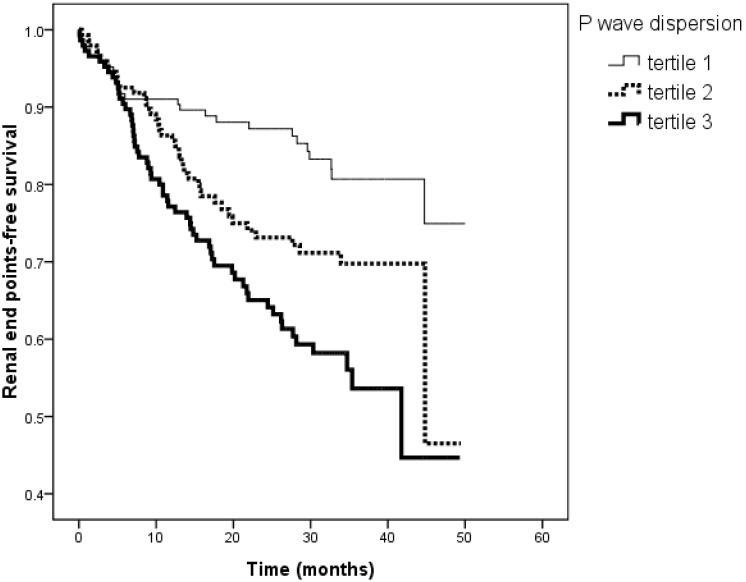
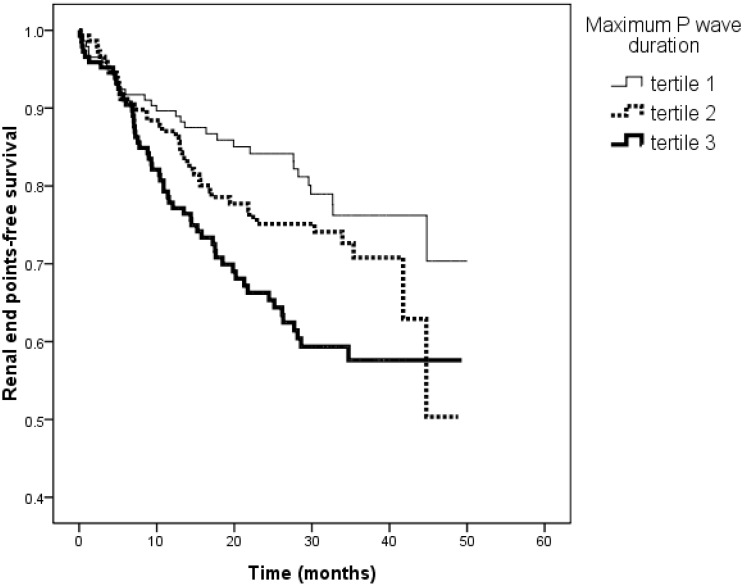
P wave parameters measured by 12-lead electrocardiogram (ECG) are commonly used as a noninvasive tool to evaluate left atrial enlargement. This study was designed to assess whether P wave parameters were associated with renal outcomes in chronic kidney disease (CKD) patients. This longitudinal study enrolled 439 patients with CKD stages 3-5. Renal end points were defined as the commencement of dialysis or death. Change in renal function was measured using the estimated glomerular filtration rate (eGFR) slope. We measured two ECG P wave parameters corrected for heart rate, i.e., corrected P wave dispersion and corrected maximum P wave duration. The values of P wave dispersion and maximum P wave duration were 88.8±21.7 ms and 153.3±21.7 ms, respectively. During the follow-up period (mean, 25.2 months), 95 patients (21.6%) started hemodialysis and 30 deaths (6.8%) were recorded. Multivariate Cox regression analysis identified that increased P wave dispersion [hazard ratio (HR), 1.020; 95% confidence interval (CI), 1.009-1.032; P<0.001] and maximum P wave duration (HR, 1.013; 95% CI, 1.003-1.024; P = 0.012) were associated with progression to renal end points. Furthermore, increased P wave dispersion (unstandardized coefficient β = -0.016; P = 0.037) and maximum P wave duration (unstandardized coefficient β = -0.014; P = 0.040) were negatively associated with the eGFR slope. We demonstrated that increased P wave dispersion and maximum P wave duration were associated with progression to the renal end points of dialysis or death and faster renal function decline in CKD patients. Screening CKD patients on the basis of P wave dispersion and maximum P wave duration may help identify patients at high risk for worse renal outcomes.
通过12导联心电图(ECG)测量的P波参数通常用作评估左心房扩大的无创工具。本研究旨在评估P波参数是否与慢性肾脏病(CKD)患者的肾脏结局相关。这项纵向研究纳入了439例3-5期CKD患者。肾脏终点定义为开始透析或死亡。使用估计的肾小球滤过率(eGFR)斜率来测量肾功能变化。我们测量了两个经心率校正的心电图P波参数,即校正后的P波离散度和校正后的最大P波时限。P波离散度和最大P波时限的值分别为88.8±21.7毫秒和153.3±21.7毫秒。在随访期间(平均25.2个月),95例患者(21.6%)开始血液透析,记录到30例死亡(6.8%)。多变量Cox回归分析确定,P波离散度增加[风险比(HR),1.020;95%置信区间(CI),1.009-1.032;P<0.001]和最大P波时限(HR,1.013;95%CI,1.003-1.024;P=0.012)与进展至肾脏终点相关。此外,P波离散度增加(未标准化系数β=-0.016;P=0.037)和最大P波时限(未标准化系数β=-0.014;P=0.040)与eGFR斜率呈负相关。我们证明,P波离散度和最大P波时限增加与CKD患者进展至透析或死亡的肾脏终点以及更快的肾功能下降相关。基于P波离散度和最大P波时限对CKD患者进行筛查可能有助于识别肾脏结局较差的高危患者。