Hamstra Daniel A, Johnson Skyler B, Daignault Stephanie, Zikmund-Fisher Brian J, Taylor Jeremy M G, Larkin Knoll, Wood Alexander, Fagerlin Angela
Department of Radiation Oncology, University of Michigan, Ann Arbor (DAH, SBJ)
Department of Biostatistics, University of Michigan, Ann Arbor (SD, JMGT)
Med Decis Making. 2015 Jan;35(1):27-36. doi: 10.1177/0272989X14551639. Epub 2014 Oct 2.
. Given the long natural history of prostate cancer, we assessed differing graphical formats for imparting knowledge about the longitudinal risks of prostate cancer recurrence with or without 'hormone' or 'androgen deprivation' therapy.
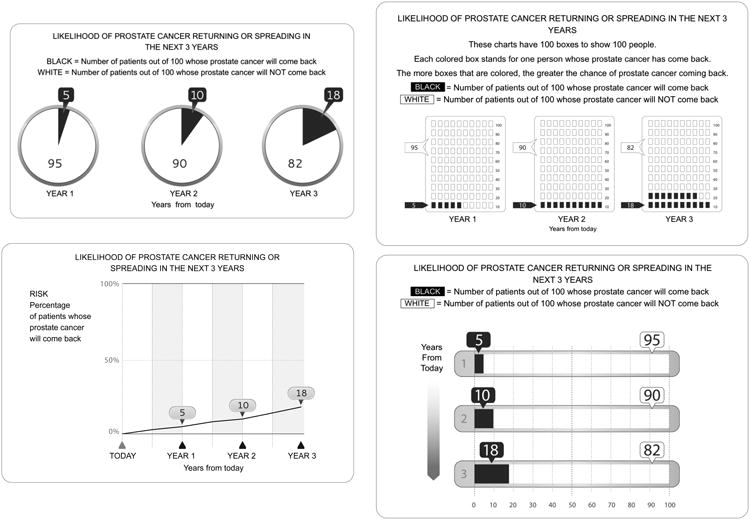
. Male volunteers without a history of prostate cancer were randomized to 1 of 8 risk communication instruments that depicted the likelihood of prostate cancer returning or spreading over 1, 2, and 3 years. The tools differed in format (line, pie, bar, or pictograph) and whether the graph also included no numbers, 1 number (indicating the number of affected individuals), or 2 numbers (indicting both the number affected and the number unaffected). The main outcome variables evaluated were graphical preference and knowledge.
. A total of 420 men were recruited; respondents were least familiar and experienced with pictographs (P < 0.0001), and only 10% preferred this particular format. Overall accuracy ranged from 79% to 92%, and when assessed across all graphical subtypes, the addition of numerical information did not improve verbatim knowledge (P = 0.1). Self-reported numeracy was a strong predictor of accuracy of responses (odds ratio [OR] = 2.6, P = 0.008), and the impact of high numeracy varied across graphical type, having a greater impact on line (OR = 5.1; 95% confidence interval [CI] = 1.6-16; P = 0.04) and pie charts (OR = 7.1; 95% CI = 2.6-19; P =0.01), without an impact on pictographs (OR = 0.4; 95% CI = 0.1-1.7; P = 0.17) or bar charts (OR = 0.5; 95% CI = 0.1-1.8; P = 0.24).
. For longitudinal presentation of risk, baseline numeracy was strongly prognostic for outcome. However, the addition of numbers to risk graphs improved only the delivery of verbatim knowledge for subjects with lower numeracy. Although subjects reported the least familiarity with pictographs, they were one of the most effective means of transferring information regardless of numeracy.
鉴于前列腺癌的自然病程较长,我们评估了不同的图形格式,以传达关于接受或未接受“激素”或“雄激素剥夺”治疗的前列腺癌复发纵向风险的知识。
没有前列腺癌病史的男性志愿者被随机分配到8种风险沟通工具中的一种,这些工具描绘了前列腺癌在1年、2年和3年内复发或扩散的可能性。这些工具在格式(线图、饼图、柱状图或象形图)以及图表是否还包括无数字、1个数字(表示受影响个体的数量)或2个数字(表示受影响和未受影响的个体数量)方面存在差异。评估的主要结果变量是图形偏好和知识。
共招募了420名男性;受访者对象形图最不熟悉且经验最少(P < 0.0001),只有10%的人喜欢这种特定格式。总体准确率在79%至92%之间,在评估所有图形亚型时,添加数字信息并未提高逐字知识(P = 0.1)。自我报告的计算能力是反应准确性的有力预测指标(优势比[OR] = 2.6,P = 0.008),高计算能力的影响因图形类型而异,对线图(OR = 5.1;95%置信区间[CI] = 1.6 - 16;P = 0.04)和饼图(OR = 7.1;95% CI = 2.6 - 19;P = 0.01)的影响更大,对象形图(OR = 0.4;95% CI = 0.1 - 1.7;P = 0.17)或柱状图(OR = 0.5;95% CI = 0.1 - 1.8;P = 0.24)没有影响。
对于风险的纵向呈现,基线计算能力对结果具有强烈的预后意义。然而,在风险图中添加数字仅改善了计算能力较低受试者的逐字知识传递。尽管受试者报告对象形图最不熟悉,但无论计算能力如何,象形图都是最有效的信息传递方式之一。