Rahman Salman A, West Sheila K, Mkocha Harran, Munoz Beatriz, Porco Travis C, Keenan Jeremy D, Lietman Thomas M
F.I. Proctor Foundation, San Francisco, California, United States of America.
Dana Center for Preventive Ophthalmology, Johns Hopkins University, Baltimore, Maryland, United States of America.
PLoS Negl Trop Dis. 2015 Mar 27;9(3):e0003682. doi: 10.1371/journal.pntd.0003682. eCollection 2015 Mar.
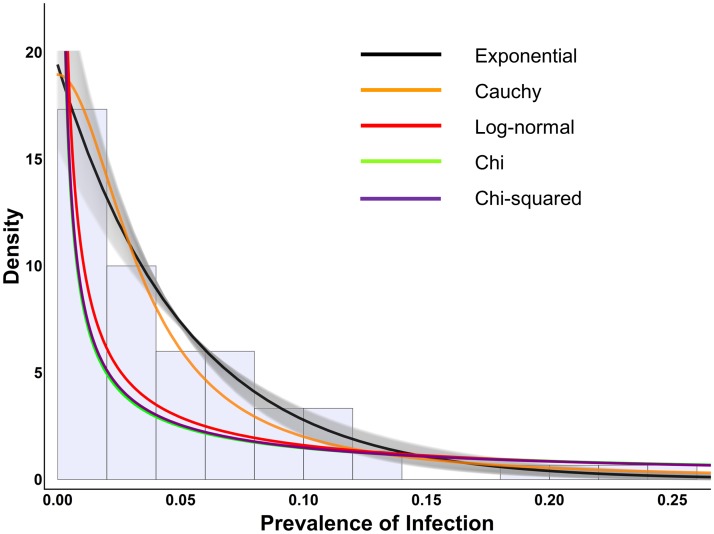
Mathematical models predict an exponential distribution of infection prevalence across communities where a disease is disappearing. Trachoma control programs offer an opportunity to test this hypothesis, as the World Health Organization has targeted trachoma for elimination as a public health concern by the year 2020. Local programs may benefit if a single survey could reveal whether infection was headed towards elimination. Using data from a previously-published 2009 survey, we test the hypothesis that Chlamydia trachomatis prevalence across 75 Tanzanian communities where trachoma had been documented to be disappearing is exponentially distributed.
METHODS/FINDINGS: We fit multiple continuous distributions to the Tanzanian data and found the exponential gave the best approximation. Model selection by Akaike Information Criteria (AICc) suggested the exponential distribution had the most parsimonious fit to the data. Those distributions which do not include the exponential as a special or limiting case had much lower likelihoods of fitting the observed data. 95% confidence intervals for shape parameter estimates of those distributions which do include the exponential as a special or limiting case were consistent with the exponential. Lastly, goodness-of-fit testing was unable to reject the hypothesis that the prevalence data came from an exponential distribution.
Models correctly predict that infection prevalence across communities where a disease is disappearing is best described by an exponential distribution. In Tanzanian communities where local control efforts had reduced the clinical signs of trachoma by 80% over 10 years, an exponential distribution gave the best fit to prevalence data. An exponential distribution has a relatively heavy tail, thus occasional high-prevalence communities are to be expected even when infection is disappearing. A single cross-sectional survey may be able to reveal whether elimination efforts are on-track.
数学模型预测,在一种疾病正在消失的各个社区中,感染患病率呈指数分布。沙眼控制项目提供了检验这一假设的机会,因为世界卫生组织已将沙眼作为一个公共卫生问题,目标是到2020年予以消除。如果一次单一调查能够揭示感染是否正朝着消除的方向发展,那么地方项目可能会从中受益。我们利用先前发表的2009年一项调查的数据,检验了这样一个假设:在75个有记录表明沙眼正在消失的坦桑尼亚社区中,沙眼衣原体患病率呈指数分布。
方法/研究结果:我们对坦桑尼亚的数据拟合了多种连续分布,发现指数分布给出了最佳近似。通过赤池信息准则(AICc)进行模型选择表明,指数分布对数据的拟合最为简约。那些不包括指数分布作为特殊或极限情况的分布对观测数据的拟合可能性要低得多。对于那些确实包括指数分布作为特殊或极限情况的分布,其形状参数估计值的95%置信区间与指数分布一致。最后,拟合优度检验无法拒绝患病率数据来自指数分布这一假设。
模型正确地预测,在一种疾病正在消失的各个社区中,感染患病率最好用指数分布来描述。在坦桑尼亚的社区中,当地的控制措施在10年内已将沙眼的临床症状减少了80%,指数分布对患病率数据的拟合效果最佳。指数分布有一个相对较重的尾部,因此即使感染正在消失,偶尔出现高患病率的社区也是可以预期的。一次单一的横断面调查也许能够揭示消除工作是否在正轨上。