Medina-Rosas Jorge, Gladman Dafna D, Su Jiandong, Sabapathy Arthy, Urowitz Murray B, Touma Zahi
Clinical and Research Fellow, University of Toronto Lupus Clinic, Toronto Western Hospital, Centre for Prognosis Studies in the Rheumatic Diseases, Toronto, ON, Canada.
Toronto Western Research Institute, University of Toronto, Toronto, ON, Canada.
Arthritis Res Ther. 2015 Oct 24;17:296. doi: 10.1186/s13075-015-0808-x.
In this study, we determined: (1) the utility of an untimed sample of urine protein/creatinine ratio (PCR) as a screening test for proteinuria, (2) its ability to accurately measure proteinuria, and (3) cutoff values for PCR predicting protein content in a 24-h urine collection sample (24hP) of 0.5, 1.0, and 2.0 g/day.
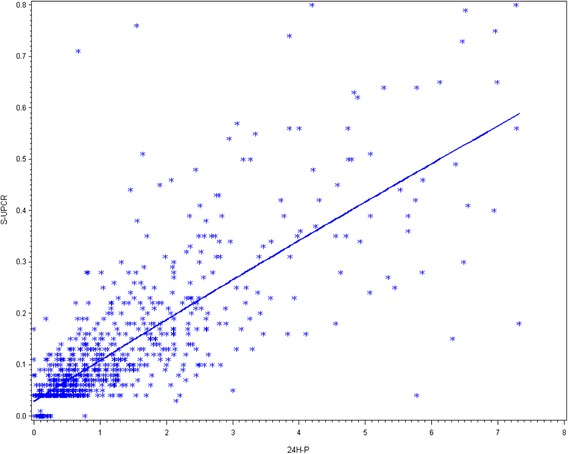
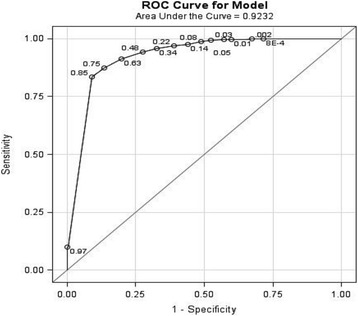
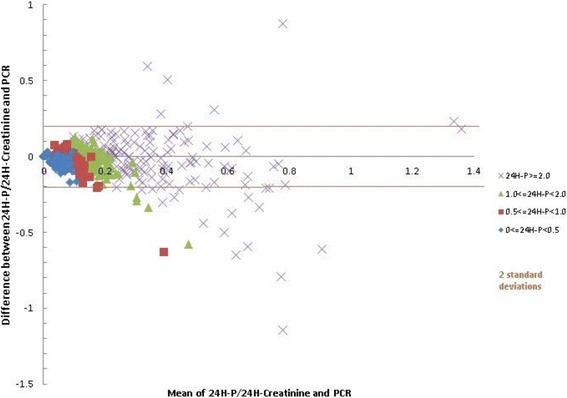
Analysis was performed on data from a single lupus cohort (2008-2014). Proteinuria was measured in a 24hP and with PCR. On the basis of 24hP, samples were divided into 4 groups: group 1, <0.5 g/day; group 2, 0.5-0.99 g/day; group 3, 1-1.99 g/day; and group 4, ≥2 g/day. To determine the validity of PCR in screening for proteinuria, the Pearson correlation coefficient was determined for the urine samples with normal PCR (<0.05 g/mmol) and normal 24hP (<0.5 g/day). The sensitivity, specificity, positive predictive value (PPV), and negative predictive value (NPV) of PCR were calculated. To determine the ability of PCR to accurately measure the level of proteinuria, in addition to the correlation between 24hP and PCR, agreement was determined by intraclass correlation coefficient, concordance correlation coefficient, and Bland-Altman plot between 24hP/24hC and PCR. The best cutoffs for PCR predicting a 24hP of 0.5, 1.0, and 2.0 g/day were determined with the receiver operating characteristic curve.
The correlation of the samples with normal PCR as well as 24hP (n = 552) was 0.29 (p < 0.0001). PCR sensitivity and specificity against 24hP were 91 % and 83 %, respectively. The PPV was 82.5 %, and the NPV was 91.4 %. The correlation for all samples (n = 1233) was high, but low to moderate for groups 1, 2, 3, and 4. The agreement for all samples was appropriate but poor for groups 1, 2, 3, and 4. PCR cutoffs for 24hP of 0.5, 1.0, and 2.0 g/day were 0.08, 0.16, and 0.35 g/mmol, respectively.
PCR can be used as a screening test for proteinuria, and the best cutoff value to predict a 24hP of 0.5 g/day is 0.08 g/mmol (800 mg/g). The accurate level of proteinuria should be measured by the gold standard test, 24hP.
在本研究中,我们确定了:(1)随机尿蛋白/肌酐比值(PCR)作为蛋白尿筛查试验的效用;(2)其准确测量蛋白尿的能力;(3)PCR预测24小时尿蛋白收集样本(24hP)中蛋白含量分别为0.5、1.0和2.0g/天的临界值。
对单个狼疮队列(2008 - 2014年)的数据进行分析。通过24hP和PCR测量蛋白尿。根据24hP,样本分为4组:第1组,<0.5g/天;第2组,0.5 - 0.99g/天;第3组,1 - 1.99g/天;第4组,≥2g/天。为确定PCR筛查蛋白尿的有效性,对PCR正常(<0.05g/mmol)且24hP正常(<0.5g/天)的尿样测定Pearson相关系数。计算PCR的敏感性、特异性、阳性预测值(PPV)和阴性预测值(NPV)。为确定PCR准确测量蛋白尿水平的能力,除了24hP与PCR之间的相关性外,还通过组内相关系数、一致性相关系数以及24hP/24hC与PCR之间的Bland - Altman图来确定一致性。用受试者工作特征曲线确定预测24hP分别为0.5、1.0和2.0g/天的PCR最佳临界值。
PCR正常且24hP正常的样本(n = 552)的相关性为0.29(p < 0.0001)。PCR针对24hP的敏感性和特异性分别为91%和83%。PPV为82.5%,NPV为91.4%。所有样本(n = 1233)的相关性较高,但第1、2、3和4组的相关性为低到中度。所有样本的一致性合适,但第1、2、3和4组的一致性较差。预测24hP为0.5、1.0和2.0g/天的PCR临界值分别为0.08、0.16和0.35g/mmol。
PCR可作为蛋白尿的筛查试验,预测24hP为0.5g/天的最佳临界值为0.08g/mmol(800mg/g)。蛋白尿的准确水平应用金标准试验24hP来测量。