Liao Minlei, Li Yunfeng, Kianifard Farid, Obi Engels, Arcona Stephen
KMK Consulting, Inc, 23 Headquarters Plaza, Morristown, NJ, 07960, USA.
Outcomes Research Methods & Analytics, US Health Economics & Outcomes Research, Novartis Pharmaceuticals Corporation, One Health Plaza, East Hanover, NJ, 07936-1080, USA.
BMC Nephrol. 2016 Mar 2;17:25. doi: 10.1186/s12882-016-0238-2.
Cluster analysis (CA) is a frequently used applied statistical technique that helps to reveal hidden structures and "clusters" found in large data sets. However, this method has not been widely used in large healthcare claims databases where the distribution of expenditure data is commonly severely skewed. The purpose of this study was to identify cost change patterns of patients with end-stage renal disease (ESRD) who initiated hemodialysis (HD) by applying different clustering methods.
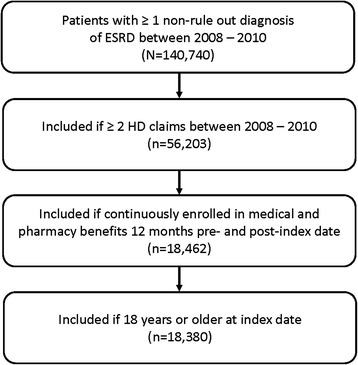
A retrospective, cross-sectional, observational study was conducted using the Truven Health MarketScan® Research Databases. Patients aged ≥18 years with ≥2 ESRD diagnoses who initiated HD between 2008 and 2010 were included. The K-means CA method and hierarchical CA with various linkage methods were applied to all-cause costs within baseline (12-months pre-HD) and follow-up periods (12-months post-HD) to identify clusters. Demographic, clinical, and cost information was extracted from both periods, and then examined by cluster.
A total of 18,380 patients were identified. Meaningful all-cause cost clusters were generated using K-means CA and hierarchical CA with either flexible beta or Ward's methods. Based on cluster sample sizes and change of cost patterns, the K-means CA method and 4 clusters were selected: Cluster 1: Average to High (n = 113); Cluster 2: Very High to High (n = 89); Cluster 3: Average to Average (n = 16,624); or Cluster 4: Increasing Costs, High at Both Points (n = 1554). Median cost changes in the 12-month pre-HD and post-HD periods increased from $185,070 to $884,605 for Cluster 1 (Average to High), decreased from $910,930 to $157,997 for Cluster 2 (Very High to High), were relatively stable and remained low from $15,168 to $13,026 for Cluster 3 (Average to Average), and increased from $57,909 to $193,140 for Cluster 4 (Increasing Costs, High at Both Points). Relatively stable costs after starting HD were associated with more stable scores on comorbidity index scores from the pre-and post-HD periods, while increasing costs were associated with more sharply increasing comorbidity scores.
The K-means CA method appeared to be the most appropriate in healthcare claims data with highly skewed cost information when taking into account both change of cost patterns and sample size in the smallest cluster.
聚类分析(CA)是一种常用的应用统计技术,有助于揭示大数据集中隐藏的结构和“聚类”。然而,这种方法在大型医疗费用报销数据库中尚未得到广泛应用,在这类数据库中,支出数据的分布通常严重偏态。本研究的目的是通过应用不同的聚类方法,识别开始进行血液透析(HD)的终末期肾病(ESRD)患者的费用变化模式。
使用Truven Health MarketScan®研究数据库进行了一项回顾性、横断面观察性研究。纳入2008年至2010年间开始进行HD且年龄≥18岁、有≥2次ESRD诊断的患者。将K均值CA方法和采用各种连锁方法的层次CA方法应用于基线期(HD前12个月)和随访期(HD后12个月)的全因费用,以识别聚类。从两个时期提取人口统计学、临床和费用信息,然后按聚类进行检查。
共识别出18380例患者。使用K均值CA方法以及采用灵活贝塔法或沃德法的层次CA方法生成了有意义的全因费用聚类。根据聚类样本量和费用模式变化,选择了K均值CA方法和4个聚类:聚类1:平均至高(n = 113);聚类2:非常高至高(n = 89);聚类3:平均至平均(n = 16624);聚类4:费用增加,两点均高(n = 1554)。聚类1(平均至高)在HD前12个月和HD后12个月的费用中位数变化从185070美元增加到884605美元,聚类2(非常高至高)从910930美元减少到157997美元,聚类3(平均至平均)相对稳定且保持在较低水平,从15168美元到13026美元,聚类4(费用增加,两点均高)从57909美元增加到193140美元。开始HD后费用相对稳定与HD前后合并症指数评分更稳定相关,而费用增加与合并症评分急剧增加相关。
在考虑费用模式变化和最小聚类中的样本量时,K均值CA方法似乎最适用于费用信息高度偏态的医疗费用报销数据。