Wang Hong-Yang, Liu Long-Shan, Cao Hai-Ming, Li Jun, Deng Rong-Hai, Fu Qian, Zhang Huan-Xi, Fei Ji-Guang, Wang Chang-Xi
Organ Transplant Center, The First Affiliated Hospital of Sun Yat-sen University, Guangzhou, Guangdong 510080, China.
Organ Transplant Center, The First Affiliated Hospital of Sun Yat-sen University, Guangzhou, Guangdong 510080; Guangdong Provincial Key Laboratory on Organ Donation and Transplant Immunology, Guangzhou, Guangdong 510080, China.
Chin Med J (Engl). 2017;130(1):23-31. doi: 10.4103/0366-6999.196569.
Accumulating studies on computational fluid dynamics (CFD) support the involvement of hemodynamic factors in artery stenosis. Based on a patient-specific CFD model, the present study aimed to investigate the hemodynamic characteristics of transplant renal artery stenosis (TRAS) and its alteration after stent treatment.
Computed tomography angiography (CTA) data of kidney transplant recipients in a single transplant center from April 2013 to November 2014 were reviewed. The three-dimensional geometry of transplant renal artery (TRA) was reconstructed from the qualified CTA images and categorized into three groups: the normal, stenotic, and stented groups. Hemodynamic parameters including pressure distribution, velocity, wall shear stress (WSS), and mass flow rate (MFR) were extracted. The data of hemodynamic parameters were expressed as median (interquartile range), and Mann-Whitney U-test was used for analysis.
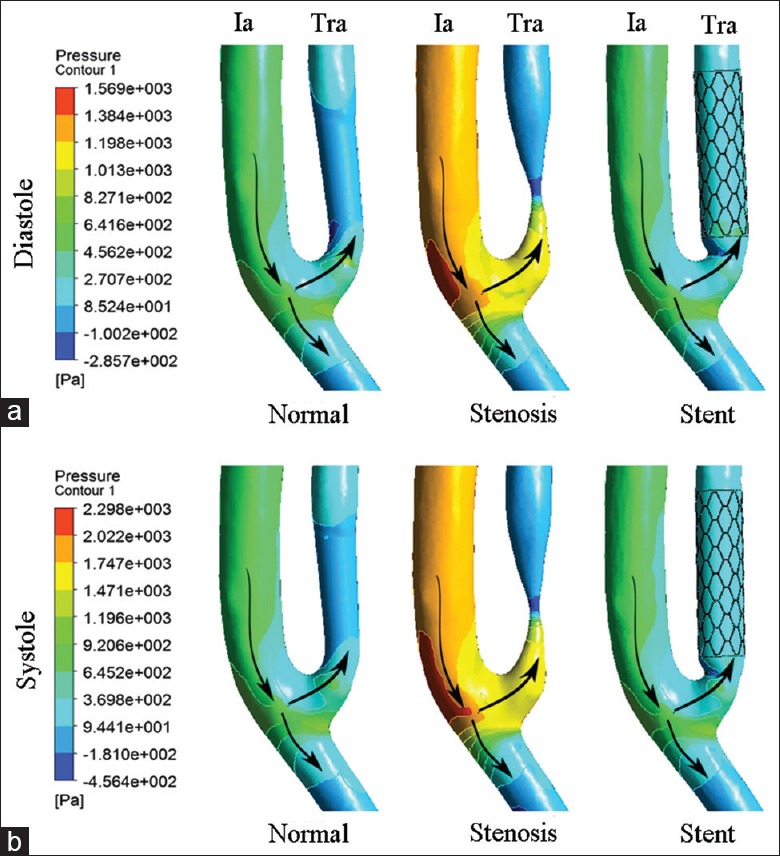
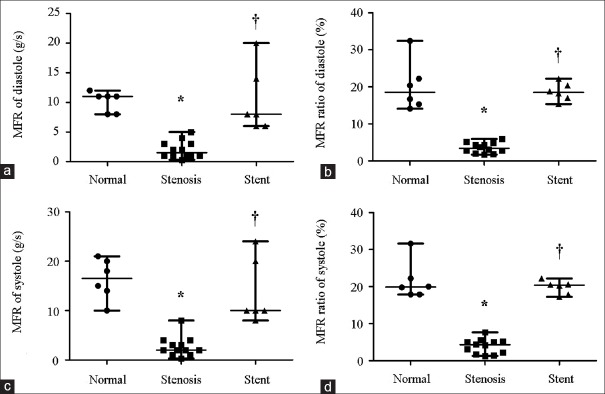
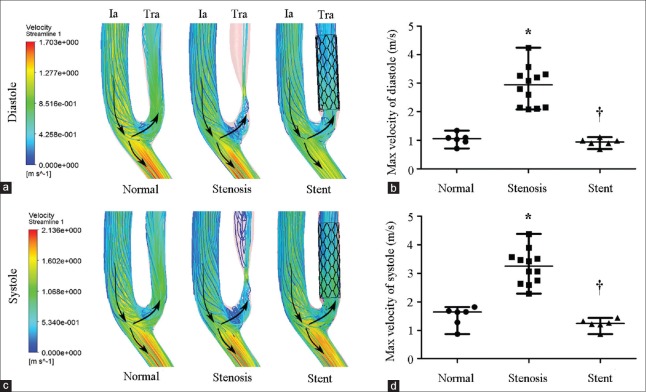
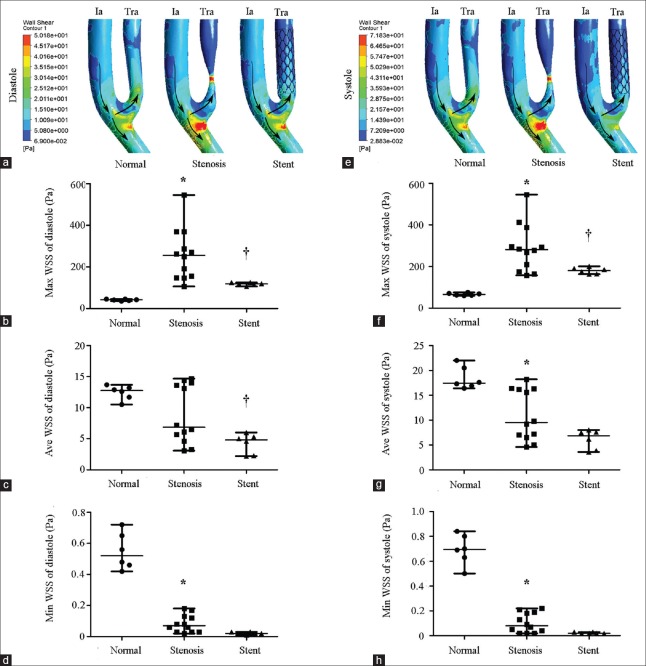
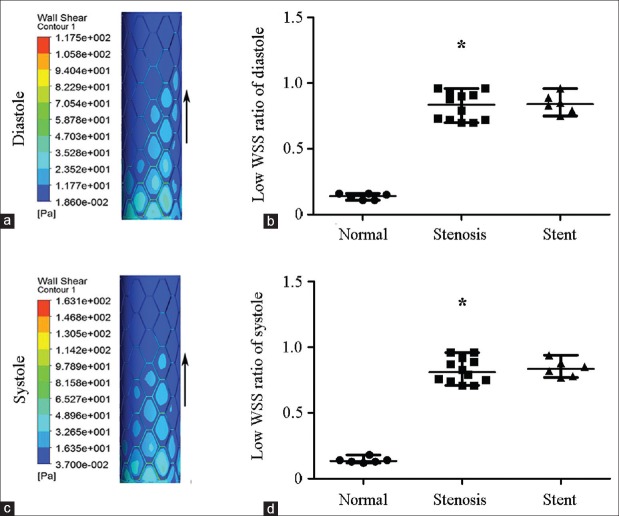
Totally, 6 normal, 12 stenotic, and 6 stented TRAs were included in the analysis. TRAS presented nonuniform pressure distribution, adverse pressure gradient across stenosis throat, flow vortex, and a separation zone at downstream stenosis. Stenotic arteries had higher maximal velocity and maximal WSS (2.94 [2.14, 3.30] vs. 1.06 [0.89, 1.15] m/s, 256.5 [149.8, 349.4] vs. 41.7 [37.8, 45.3] Pa at end diastole, P= 0.001; 3.25 [2.67, 3.56] vs. 1.65 [1.18, 1.72] m/s, 281.3 [184.3, 364.7] vs. 65.8 [61.2, 71.9] Pa at peak systole, P= 0.001) and lower minimal WSS and MFRs (0.07 [0.03, 0.13] vs. 0.52 [0.45, 0.67] Pa, 1.5 [1.0, 3.0] vs. 11.0 [8.0, 11.3] g/s at end diastole, P= 0.001; 0.08 [0.03, 0.19] vs. 0.70 [0.60, 0.81] Pa, 2.0 [1.3, 3.3] vs. 16.5 [13.0, 20.3] g/s at peak systole, P= 0.001) as compared to normal arteries. Stent implantation ameliorated all the alterations of the above hemodynamic factors except low WSS.
Hemodynamic factors were significantly changed in severe TRAS. Stent implantation can restore or ameliorate deleterious change of hemodynamic factors except low WSS at stent regions.
越来越多关于计算流体动力学(CFD)的研究支持血流动力学因素参与动脉狭窄。基于患者特异性CFD模型,本研究旨在探讨移植肾动脉狭窄(TRAS)的血流动力学特征及其支架治疗后的变化。
回顾了2013年4月至2014年11月在单个移植中心的肾移植受者的计算机断层血管造影(CTA)数据。从合格的CTA图像重建移植肾动脉(TRA)的三维几何结构,并分为三组:正常组、狭窄组和支架植入组。提取包括压力分布、速度、壁面切应力(WSS)和质量流量率(MFR)在内的血流动力学参数。血流动力学参数数据以中位数(四分位间距)表示,采用Mann-Whitney U检验进行分析。
分析共纳入6条正常TRA、12条狭窄TRA和6条支架植入TRA。TRAS表现为压力分布不均匀、狭窄喉部存在不利压力梯度、血流漩涡以及狭窄下游的分离区。与正常动脉相比,狭窄动脉在舒张末期具有更高的最大速度和最大WSS(2.94 [2.14, 3.30] 与1.06 [0.89, 1.15] m/s,256.5 [149.8, 349.4] 与41.7 [37.8, 45.3] Pa,P = 0.001;收缩期峰值时为3.25 [2.67, 3.56] 与1.65 [1.18, 1.72] m/s,281.3 [184.3, 364.7] 与65.8 [61.2, 71.9] Pa,P = 0.001),以及更低的最小WSS和MFR(舒张末期为0.07 [0.03, 0.13] 与0.52 [0.45, 0.67] Pa,1.5 [1.0, 3.0] 与11.0 [8.0, 11.3] g/s,P = 0.001;收缩期峰值时为0.08 [0.03, 0.19] 与0.70 [0.60, 0.81] Pa,2.0 [1.3, 3.3] 与16.5 [13.0, 20.3] g/s,P = 0.001)。支架植入改善了上述血流动力学因素的所有变化,但低WSS除外。
严重TRAS时血流动力学因素发生显著改变。支架植入可恢复或改善血流动力学因素的有害变化,但支架区域的低WSS除外。