Cox Daniel J, Gonder-Frederick Linda A, Singh Harsimran, Ingersoll Karen S, Banton Tom, Grabman Jesse H, Schmidt Karen, Clarke William
University of Virginia School of Medicine, Charlottesville, VA
University of Virginia School of Medicine, Charlottesville, VA.
Diabetes Care. 2017 Jun;40(6):742-750. doi: 10.2337/dc16-0995. Epub 2017 Apr 12.
Two aims of this study were to develop and validate A) a metric to identify drivers with type 1 diabetes at high risk of future driving mishaps and B) an online intervention to reduce mishaps among high-risk drivers.
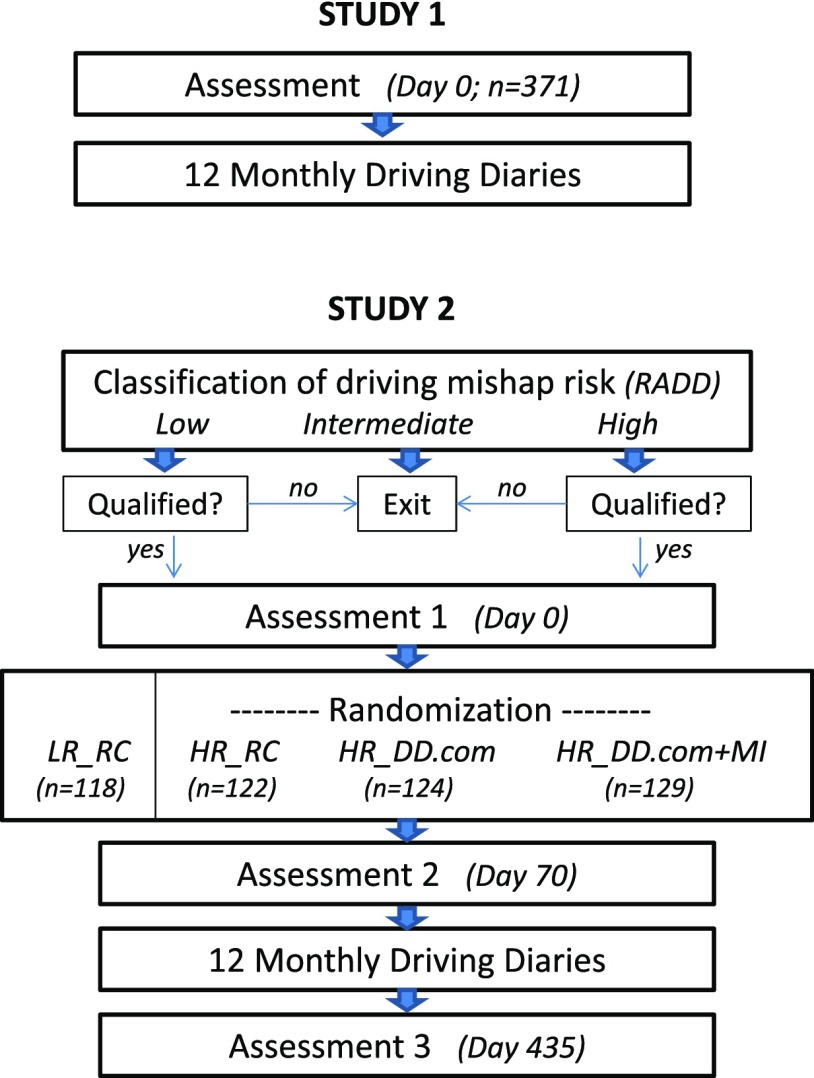
To achieve aim A, in study 1, 371 drivers with type 1 diabetes from three U.S. regions completed a series of established questionnaires about diabetes and driving. They recorded their driving mishaps over the next 12 months. Questionnaire items that uniquely discriminated drivers who did and did not have subsequent driving mishaps were assembled into the Risk Assessment of Diabetic Drivers (RADD) scale. In study 2, 1,737 drivers with type 1 diabetes from all 50 states completed the RADD online. Among these, 118 low-risk (LR) and 372 high-risk (HR) drivers qualified for and consented to participate in a 2-month treatment period followed by 12 monthly recordings of driving mishaps. To address aim B, HR participants were randomized to receive either routine care (RC) or the online intervention "DiabetesDriving.com" (DD.com). Half of the DD.com participants received a motivational interview (MI) at the beginning and end of the treatment period to boost participation and efficacy. All of the LR participants were assigned to RC. In both studies, the primary outcome variable was driving mishaps.
Related to aim A, in study 1, the RADD demonstrated 61% sensitivity and 75% specificity. Participants in the upper third of the RADD distribution (HR), compared with those in the lower third (LR), reported 3.03 vs. 0.87 mishaps/driver/year, respectively ( < 0.001). In study 2, HR and LR participants receiving RC reported 4.3 and 1.6 mishaps/driver/year, respectively ( < 0.001). Related to aim B, in study 2, MIs did not enhance participation or efficacy, so the DD.com and DD.com + MI groups were combined. DD.com participants reported fewer hypoglycemia-related driving mishaps than HR participants receiving RC ( = 0.01), but more than LR participants receiving RC, reducing the difference between the HR and LR participants receiving RC by 63%. HR drivers differed from LR drivers at baseline across a variety of hypoglycemia and driving parameters.
The RADD identified higher-risk drivers, and identification seemed relatively stable across time, samples, and procedures. This 11-item questionnaire could inform patients at higher risk, and their clinicians, that they should take preventive steps to reduce driving mishaps, which was accomplished in aim B using DD.com.
本研究有两个目标,一是开发并验证A)一种指标,以识别未来发生驾驶事故风险较高的1型糖尿病司机;二是开发一种在线干预措施,以减少高风险司机的事故发生率。
为实现目标A,在研究1中,来自美国三个地区的371名1型糖尿病司机完成了一系列关于糖尿病和驾驶的既定问卷。他们记录了接下来12个月内的驾驶事故。将能够唯一区分发生和未发生后续驾驶事故的司机的问卷项目汇总成糖尿病司机风险评估(RADD)量表。在研究2中,来自美国所有50个州的1737名1型糖尿病司机在线完成了RADD量表。其中,118名低风险(LR)和372名高风险(HR)司机符合条件并同意参加为期2个月的治疗期,随后每月记录12次驾驶事故。为实现目标B,HR参与者被随机分配接受常规护理(RC)或在线干预“DiabetesDriving.com”(DD.com)。一半的DD.com参与者在治疗期开始和结束时接受了动机访谈(MI),以提高参与度和疗效。所有LR参与者都被分配到RC组。在两项研究中,主要结果变量都是驾驶事故。
与目标A相关,在研究1中,RADD的敏感性为61%,特异性为75%。RADD分布上三分之一(HR)的参与者与下三分之一(LR)的参与者相比,报告的事故发生率分别为每年每位司机3.03次和0.87次(P<0.001)。在研究2中,接受RC的HR和LR参与者报告的事故发生率分别为每年每位司机4.3次和1.6次(P<0.001)。与目标B相关,在研究2中,MI并未提高参与度或疗效,因此将DD.com组和DD.com+MI组合并。DD.com参与者报告的与低血糖相关的驾驶事故比接受RC的HR参与者少(P=0.01),但比接受RC的LR参与者多,将接受RC的HR和LR参与者之间的差异缩小了63%。HR司机与LR司机在基线时在各种低血糖和驾驶参数方面存在差异。
RADD识别出了较高风险的司机,并且这种识别在时间、样本和程序上似乎相对稳定。这份包含11个项目的问卷可以告知高风险患者及其临床医生,他们应该采取预防措施以减少驾驶事故,这在目标B中通过DD.com得以实现。