Dwyer-Lindgren Laura, Mackenbach Johan P, van Lenthe Frank J, Mokdad Ali H
Institute for Health Metrics and Evaluation, University of Washington, 2301 5th Ave, Suite 600, Seattle, WA, 98121, USA.
Department of Public Health, Erasmus MC, Rotterdam, Netherlands.
Popul Health Metr. 2017 Apr 26;15(1):16. doi: 10.1186/s12963-017-0133-5.
Metrics based on self-reports of health status have been proposed for tracking population health and making comparisons among different populations. While these metrics have been used in the US to explore disparities by sex, race/ethnicity, and socioeconomic position, less is known about how self-reported health varies geographically. This study aimed to describe county-level trends in the prevalence of poor self-reported health and to assess the face validity of these estimates.
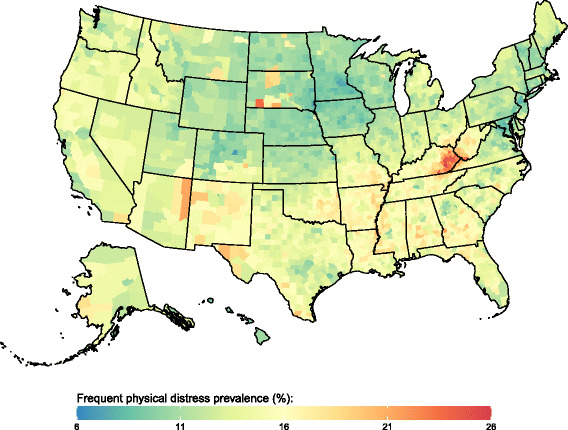
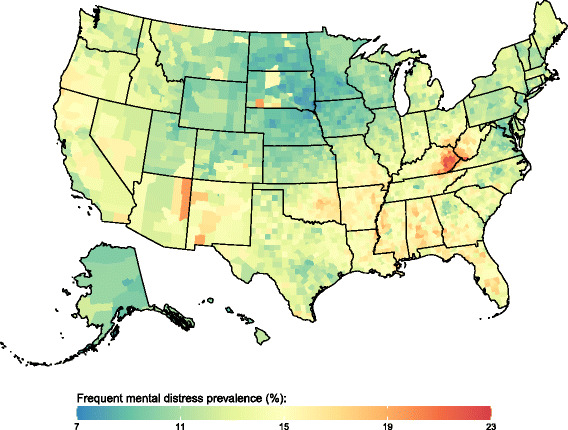
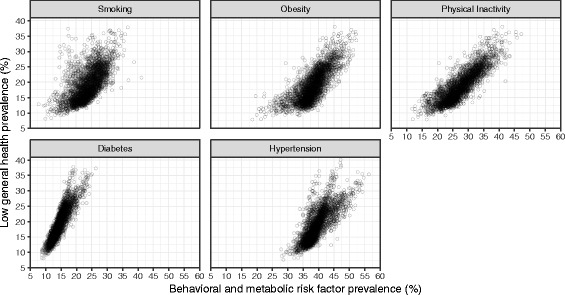
We applied validated small area estimation methods to Behavioral Risk Factor Surveillance System data to estimate annual county-level prevalence of four measures of poor self-reported health (low general health, frequent physical distress, frequent mental distress, and frequent activity limitation) from 1995 and 2012. We compared these measures of poor self-reported health to other population health indicators, including risk factor prevalence (smoking, physical inactivity, and obesity), chronic condition prevalence (hypertension and diabetes), and life expectancy.
We found substantial geographic disparities in poor self-reported health. Counties in parts of South Dakota, eastern Kentucky and western West Virginia, along the Texas-Mexico border, along the southern half of the Mississippi river, and in southern Alabama generally experienced the highest levels of poor self-reported health. At the county level, there was a strong positive correlation among the four measures of poor self-reported health and between the prevalence of poor self-reported health and the prevalence of risk factors and chronic conditions. There was a strong negative correlation between prevalence of poor self-reported health and life expectancy. Nonetheless, counties with similar levels of poor self-reported health experienced life expectancies that varied by several years. Changes over time in life expectancy were only weakly correlated with changes in the prevalence of poor self-reported health.
This analysis adds to the growing body of literature documenting large geographic disparities in health outcomes in the United States. Health metrics based on self-reports of health status can and should be used to complement other measures of population health, such as life expectancy, to identify high need areas, efficiently allocate resources, and monitor geographic disparities.
基于健康状况自我报告的指标已被提出用于跟踪人群健康状况并在不同人群之间进行比较。虽然这些指标在美国已被用于按性别、种族/族裔和社会经济地位探索差异,但关于自我报告的健康状况在地理上如何变化却知之甚少。本研究旨在描述县级自我报告健康状况不佳的患病率趋势,并评估这些估计值的表面效度。
我们将经过验证的小区域估计方法应用于行为风险因素监测系统数据,以估计1995年至2012年县级自我报告健康状况不佳的四项指标(总体健康状况差、频繁身体不适、频繁精神困扰和频繁活动受限)的年度患病率。我们将这些自我报告健康状况不佳的指标与其他人群健康指标进行了比较,包括风险因素患病率(吸烟、身体活动不足和肥胖)、慢性病患病率(高血压和糖尿病)以及预期寿命。
我们发现自我报告健康状况不佳存在显著的地理差异。南达科他州部分地区、肯塔基州东部和西弗吉尼亚州西部、德克萨斯州与墨西哥边境沿线、密西西比河下半段以及阿拉巴马州南部的县,自我报告健康状况不佳的水平普遍最高。在县级层面,自我报告健康状况不佳的四项指标之间以及自我报告健康状况不佳的患病率与风险因素和慢性病患病率之间存在很强的正相关。自我报告健康状况不佳的患病率与预期寿命之间存在很强的负相关。尽管如此,自我报告健康状况不佳水平相似的县,其预期寿命相差数年。随着时间的推移,预期寿命的变化与自我报告健康状况不佳患病率的变化仅存在微弱的相关性。
该分析增加了越来越多的文献资料,这些文献记录了美国健康结果存在巨大的地理差异。基于健康状况自我报告的健康指标可以而且应该用于补充其他人群健康指标,如预期寿命,以确定高需求地区、有效分配资源并监测地理差异。