Sasaki Rie, Maki Futaba, Hara Daisuke, Tanaka Shigeaki, Hasegawa Yasuhiro
Department of Internal Medicine, Division of Neurology, St. Marianna University School of Medicine, 2-16-1 Sugao, Miyamae, Kawasaki, Kanagawa 216-8511 Japan.
Cerebellum Ataxias. 2017 Jun 29;4:9. doi: 10.1186/s40673-017-0068-4. eCollection 2017.
The rate of disease progression differs among patients with degenerative cerebellar ataxia. The uncertain natural course in individual patients hinders clinical trials of promising treatments. In this study, we analyzed atrophy changes in brain structures with cluster analysis to find sub-groups of patients with homogenous symptom progression in a broad spectrum of degenerative cerebellar ataxias.
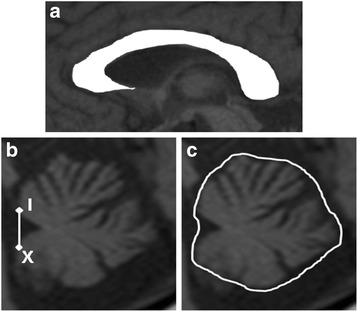
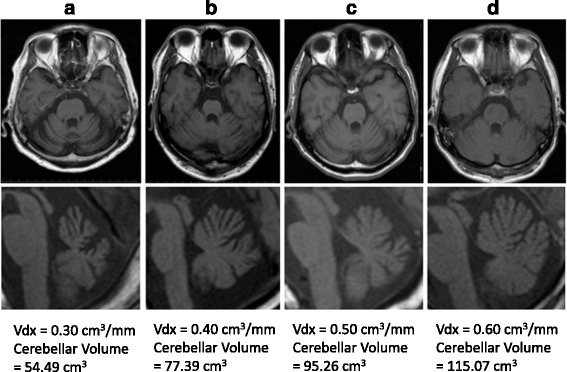
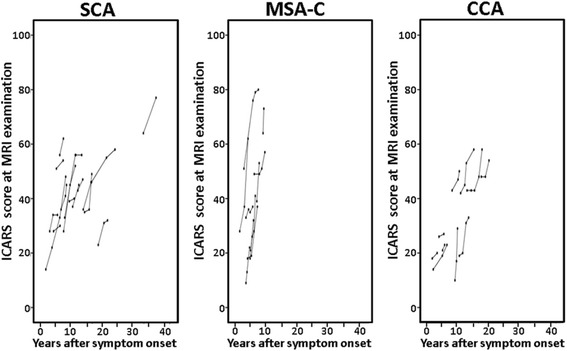
We examined 48 patients including 21 cases of spinocerebellar ataxia (SCA), 17 cases of the cerebellar type of multiple system atrophy (MSA-C), and 10 cases of cortical cerebellar ataxia (CCA). In all patients, at least two sets of evaluations including magnetic resonance imaging (MRI) and the International Cooperative Ataxia Rating Scale (ICARS) scoring were performed. The median number (min-max) of follow-up studies in each patient was three (2-6), and the mean follow-up period was 3.1 ± 1.6 years. The area of the corpus callosum on midsagittal images and the cerebellar volume were measured using MRI, and these values were divided by the cranial antero-posterior diameter of each patient to correct for individual head size differences as an area index (Adx) and a volume index (Vdx), respectively. The annual changes in Adx, Vdx, and ICARS score were calculated in each patient, and atrophy patterns in patients were categorized with cluster analysis.
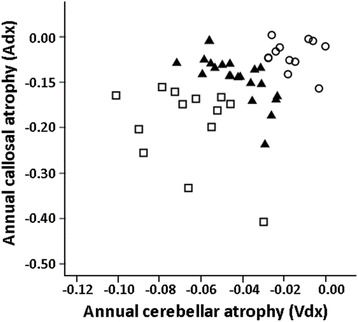
The annual atrophy rates for the corpus callosum (Adx) and cerebellum (Vdx) and symptom progression differed significantly by subtype of cerebellar ataxia ( = 0.026, 0.019, and 0.021, respectively). However, neither the annual atrophy rate of Adx nor Vdx was significantly correlated with the annual increase in the ICARS score. When the patients were categorized into three clusters based on the annual changes in Adx and Vdx, the annual increase in the ICARS score was significantly different among clusters (2.9 ± 1.7/year in Cluster 1, 4.8 ± 3.2/year in Cluster 2, and 8.7 ± 6.1/year in Cluster 3; = 0.014).
The annual increase in the ICARS score can be stratified by cluster analysis based on the atrophy rates of the corpus callosum and cerebellum. Further studies are warranted to explore whether these simple MRI methods could be used for random allocation of a broad spectrum of patients with degenerative cerebellar ataxia in clinical trials.
退行性小脑共济失调患者的疾病进展速度各不相同。个体患者不确定的自然病程阻碍了有前景的治疗方法的临床试验。在本研究中,我们通过聚类分析来分析脑结构的萎缩变化,以在广泛的退行性小脑共济失调患者中找到症状进展同质的亚组。
我们检查了48例患者,包括21例脊髓小脑共济失调(SCA)、17例多系统萎缩小脑型(MSA-C)和10例皮质小脑共济失调(CCA)。对所有患者进行了至少两组评估,包括磁共振成像(MRI)和国际合作共济失调评定量表(ICARS)评分。每位患者随访研究的中位数(最小值 - 最大值)为3次(2 - 6次),平均随访期为3.1 ± 1.6年。使用MRI测量正中矢状面图像上的胼胝体面积和小脑体积,并将这些值分别除以每位患者的颅前后径,以校正个体头部大小差异,作为面积指数(Adx)和体积指数(Vdx)。计算每位患者Adx、Vdx和ICARS评分的年度变化,并通过聚类分析对患者的萎缩模式进行分类。
胼胝体(Adx)和小脑(Vdx)的年度萎缩率以及症状进展在小脑共济失调亚型之间存在显著差异(分别为P = 0.026、0.019和0.021)。然而,Adx和Vdx的年度萎缩率均与ICARS评分的年度增加无显著相关性。当根据Adx和Vdx的年度变化将患者分为三个聚类时,ICARS评分的年度增加在各聚类之间存在显著差异(第1聚类为2.9 ± 1.7/年,第2聚类为4.8 ± 3.2/年,第3聚类为8.7 ± 6.1/年;P = 0.014)。
基于胼胝体和小脑的萎缩率,通过聚类分析可以对ICARS评分的年度增加进行分层。有必要进一步研究这些简单的MRI方法是否可用于在临床试验中对广泛的退行性小脑共济失调患者进行随机分组。