• 文献检索
  • 文档翻译
  • 深度研究
  • 学术资讯
  • Suppr Zotero 插件Zotero 插件
  • 邀请有礼
  • 套餐&价格
  • 历史记录
应用&插件
Suppr Zotero 插件Zotero 插件浏览器插件Mac 客户端Windows 客户端微信小程序
定价
高级版会员购买积分包购买API积分包
服务
文献检索文档翻译深度研究API 文档MCP 服务
关于我们
关于 Suppr公司介绍联系我们用户协议隐私条款
关注我们

Suppr 超能文献

核心技术专利:CN118964589B侵权必究
粤ICP备2023148730 号-1Suppr @ 2026

文献检索

告别复杂PubMed语法,用中文像聊天一样搜索,搜遍4000万医学文献。AI智能推荐,让科研检索更轻松。

立即免费搜索

文件翻译

保留排版,准确专业,支持PDF/Word/PPT等文件格式,支持 12+语言互译。

免费翻译文档

深度研究

AI帮你快速写综述,25分钟生成高质量综述,智能提取关键信息,辅助科研写作。

立即免费体验

北京两次红色空气污染预警期间PM浓度的时空变化及减排措施评估

Spatio-temporal variations of PM concentrations and the evaluation of emission reduction measures during two red air pollution alerts in Beijing.

作者信息

Cheng Nianliang, Zhang Dawei, Li Yunting, Xie Xiaoming, Chen Ziyue, Meng Fan, Gao Bingbo, He Bin

机构信息

College of Water Sciences, Beijing Normal University, Beijing, 100875, China.

Beijing Municipal Environmental Monitoring Center, Beijing, 100048, China.

出版信息

Sci Rep. 2017 Aug 15;7(1):8220. doi: 10.1038/s41598-017-08895-x.

DOI:10.1038/s41598-017-08895-x
PMID:28811594
原文链接:https://pmc.ncbi.nlm.nih.gov/articles/PMC5557902/
Abstract

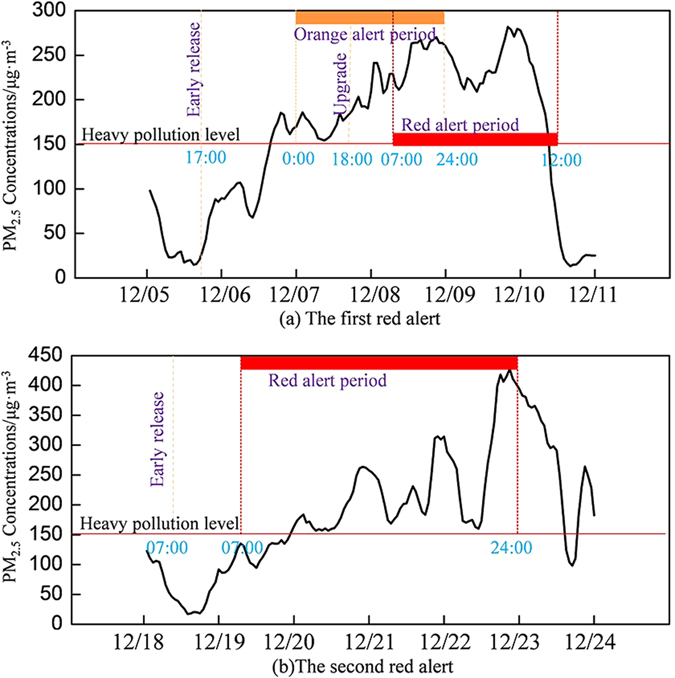
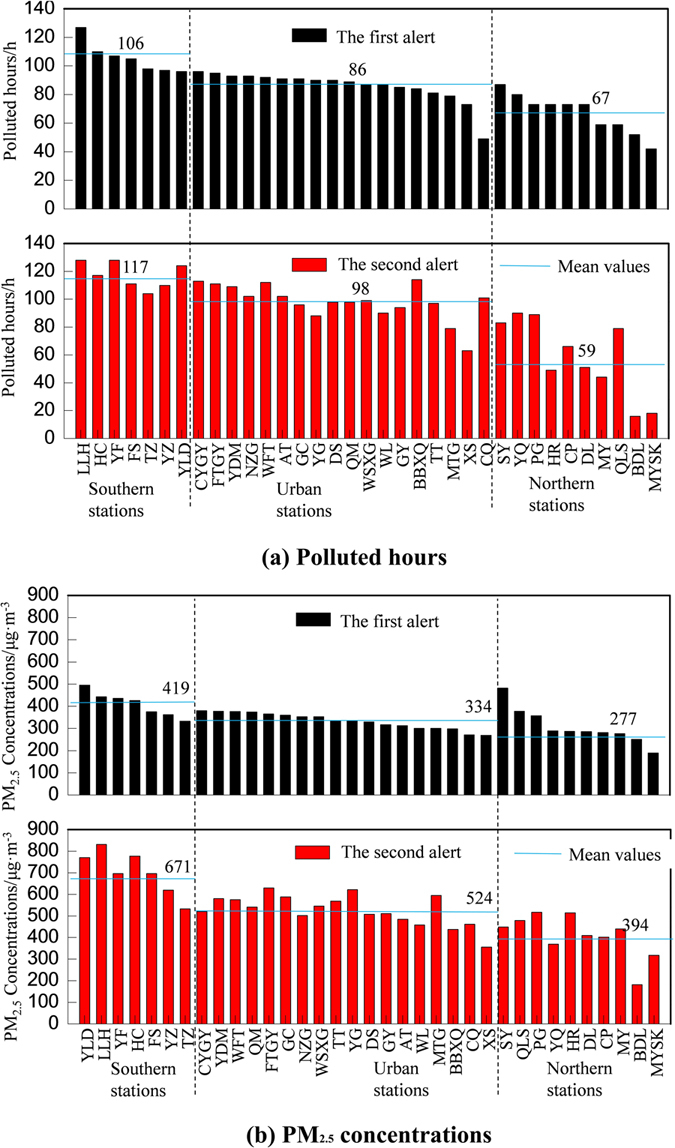
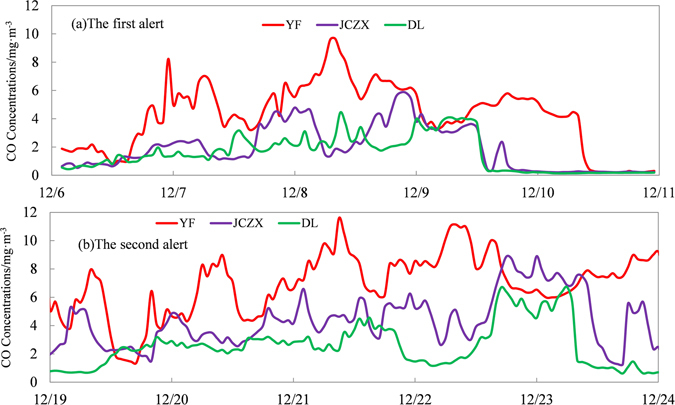
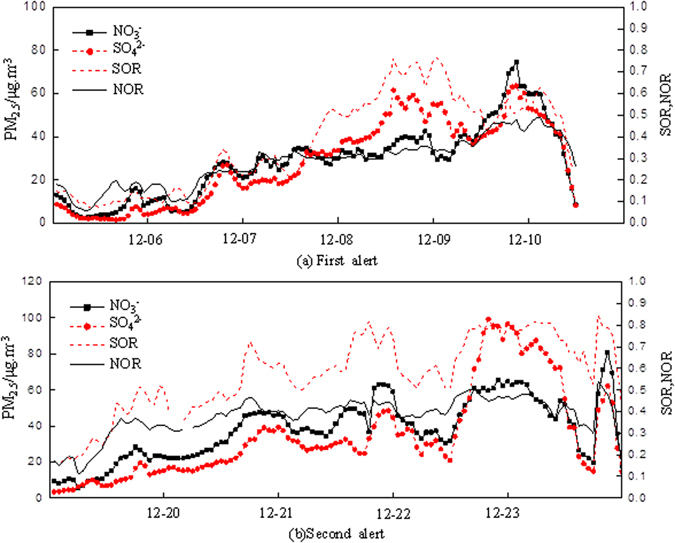
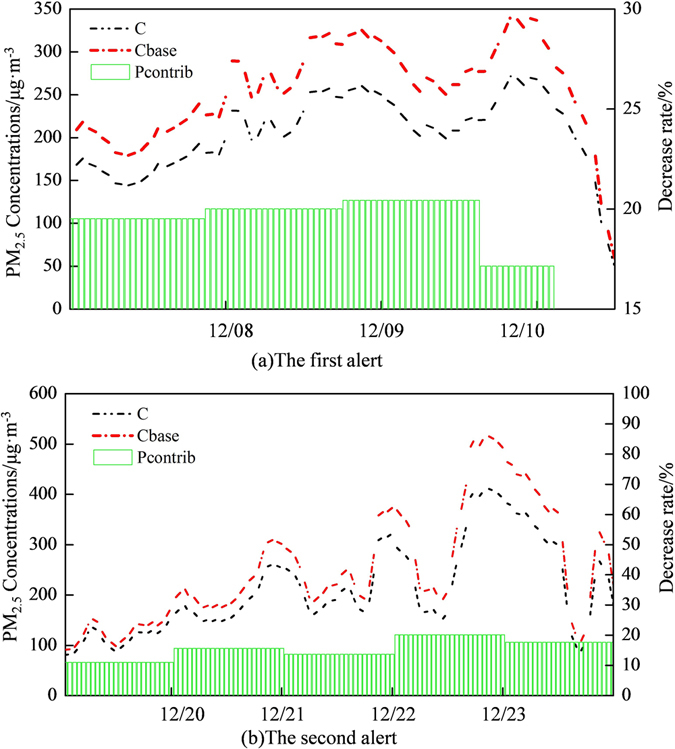
To effectively improve air quality during pollution episodes, Beijing released two red alerts in 2015. Here we examined spatio-temporal variations of PM concentrations during two alerts based on multiple data sources. Results suggested that PM concentrations varied significantly across Beijing. PM concentrations in southern parts of Beijing were higher than those in northern areas during both alerts. In addition to unfavorable meteorological conditions, coal combustion, especially incomplete coal combustion contributed significantly to the high PM concentrations. Through the CAMx model, we evaluated the effects of emission-reduction measures on PM concentrations. Through simulation, emergency measures cut down 10% - 30% of the total emissions and decreased the peaks of PM concentrations by about 10-20% during two alerts. We further examined the scenario if emergency measures were implemented several days earlier than the start of red alerts. The results proved that the implementation of emission reduction measures 1-2 days before red alerts could lower the peak of PM concentrations significantly. Given the difficulty of precisely predicting the duration of heavy pollution episodes and the fact that successive heavy pollution episodes may return after red alerts, emergency measures should also be implemented one or two days after the red alerts.

摘要

为有效改善污染期间的空气质量,北京在2015年发布了两次红色预警。在此,我们基于多源数据研究了两次预警期间细颗粒物(PM)浓度的时空变化。结果表明,北京全市的PM浓度差异显著。两次预警期间,北京南部的PM浓度均高于北部地区。除不利的气象条件外,煤炭燃烧,尤其是煤炭不完全燃烧,是导致PM浓度居高不下的重要原因。通过CAMx模型,我们评估了减排措施对PM浓度的影响。通过模拟发现,应急措施使两次预警期间的总排放量减少了10% - 30%,PM浓度峰值降低了约10% - 20%。我们进一步研究了应急措施比红色预警提前几天实施的情况。结果表明,在红色预警前1 - 2天实施减排措施可显著降低PM浓度峰值。鉴于精确预测重污染过程持续时间存在困难,且红色预警后可能会再次出现连续重污染过程,因此在红色预警结束后1 - 2天也应实施应急措施。

https://cdn.ncbi.nlm.nih.gov/pmc/blobs/3298/5557902/efe15c501a57/41598_2017_8895_Fig7_HTML.jpg
https://cdn.ncbi.nlm.nih.gov/pmc/blobs/3298/5557902/6ffc6d47e9fb/41598_2017_8895_Fig1_HTML.jpg
https://cdn.ncbi.nlm.nih.gov/pmc/blobs/3298/5557902/8c92c260a1b1/41598_2017_8895_Fig2_HTML.jpg
https://cdn.ncbi.nlm.nih.gov/pmc/blobs/3298/5557902/89da4bb78685/41598_2017_8895_Fig3_HTML.jpg
https://cdn.ncbi.nlm.nih.gov/pmc/blobs/3298/5557902/46fc3f7753f8/41598_2017_8895_Fig4_HTML.jpg
https://cdn.ncbi.nlm.nih.gov/pmc/blobs/3298/5557902/5c46a46e14c2/41598_2017_8895_Fig5_HTML.jpg
https://cdn.ncbi.nlm.nih.gov/pmc/blobs/3298/5557902/bb22482df194/41598_2017_8895_Fig6_HTML.jpg
https://cdn.ncbi.nlm.nih.gov/pmc/blobs/3298/5557902/efe15c501a57/41598_2017_8895_Fig7_HTML.jpg

相似文献

1
Spatio-temporal variations of PM concentrations and the evaluation of emission reduction measures during two red air pollution alerts in Beijing.北京两次红色空气污染预警期间PM浓度的时空变化及减排措施评估
Sci Rep. 2017 Aug 15;7(1):8220. doi: 10.1038/s41598-017-08895-x.
2
[Cause and Effect Evaluation of PM During Three Red Alerts in Beijing from 2015 to 2016].[2015年至2016年北京三次红色预警期间细颗粒物的因果关系评估]
Huan Jing Ke Xue. 2019 Jan 8;40(1):1-10. doi: 10.13227/j.hjkx.201806087.
3
[Concentration Characteristics of PM in Beijing During Two Red Alert Periods].[北京两次红色预警期间细颗粒物的浓度特征]
Huan Jing Ke Xue. 2016 Jul 8;37(7):2409-2418. doi: 10.13227/j.hjkx.2016.07.001.
4
[Comparison Analysis of the Effect of Emission Reduction Measures for Major Events and Heavy Air Pollution in the Capital].[首都重大活动及重污染天气减排措施效果对比分析]
Huan Jing Ke Xue. 2020 Aug 8;41(8):3449-3457. doi: 10.13227/j.hjkx.201910166.
5
[Characteristics of Two Pollution Episodes Before and After City Heating in Beijing from February to March of 2019].[2019年2月至3月北京城市供暖前后两次污染过程的特征]
Huan Jing Ke Xue. 2021 May 8;42(5):2110-2120. doi: 10.13227/j.hjkx.202008181.
6
Characteristics and classification of PM pollution episodes in Beijing from 2013 to 2015.2013 年至 2015 年期间北京市 PM 污染过程的特征和分类。
Sci Total Environ. 2018 Jan 15;612:170-179. doi: 10.1016/j.scitotenv.2017.08.206. Epub 2017 Sep 1.
7
[Concentration Characteristics of PM and the Causes of Heavy Air Pollution Events in Beijing During Autumn and Winter].[北京秋冬季节PM浓度特征及重污染事件成因]
Huan Jing Ke Xue. 2019 Aug 8;40(8):3405-3414. doi: 10.13227/j.hjkx.201806061.
8
[Characteristics of PM Pollution and the Efficiency of Concentration Control During a Red Alert in the Beijing-Tianjin-Hebei Region, 2016].[2016年京津冀地区红色预警期间细颗粒物污染特征及浓度控制成效]
Huan Jing Ke Xue. 2019 Aug 8;40(8):3397-3404. doi: 10.13227/j.hjkx.201811155.
9
[Assessment of Emission Reduction Effect of Major Air Pollution Control Measures on PM Concentrations During 13th Five-Year Period in Tianjin].[天津市“十三五”期间主要大气污染控制措施对PM浓度的减排效果评估]
Huan Jing Ke Xue. 2023 Jun 8;44(6):3054-3062. doi: 10.13227/j.hjkx.202208166.
10
Comparisons of two serious air pollution episodes in winter and summer in Beijing.比较北京冬、夏两季两次严重空气污染事件。
J Environ Sci (China). 2018 Jul;69:141-154. doi: 10.1016/j.jes.2017.10.002. Epub 2017 Oct 18.

引用本文的文献

1
Changing weekend effects of air pollutants in Beijing under 2020 COVID-19 lockdown controls.2020年新冠疫情封锁管控下北京空气污染物周末效应的变化
NPJ Urban Sustain. 2022;2(1):23. doi: 10.1038/s42949-022-00070-0. Epub 2022 Sep 22.
2
Evolution of Pollution Levels from COVID-19 Lockdown to Post-Lockdown over India.印度从新冠疫情封锁到解封后污染水平的演变。
Toxics. 2022 Oct 29;10(11):653. doi: 10.3390/toxics10110653.
3
DatAC: A visual analytics platform to explore climate and air quality indicators associated with the COVID-19 pandemic in Spain.

本文引用的文献

1
Characteristics and emission-reduction measures evaluation of PM during the two major events: APEC and Parade.两大事件期间 PM 的特征和减排措施评估:APEC 和阅兵。
Sci Total Environ. 2017 Oct 1;595:81-92. doi: 10.1016/j.scitotenv.2017.03.231. Epub 2017 Apr 1.
2
Detecting the causality influence of individual meteorological factors on local PM concentration in the Jing-Jin-Ji region.检测个体气象因素对京津冀地区局地 PM 浓度的因果影响。
Sci Rep. 2017 Jan 27;7:40735. doi: 10.1038/srep40735.
3
[Exploring the Severe Haze in Beijing During December, 2015: Pollution Process and Emissions Variation].
DatAC:一个用于探索与西班牙 COVID-19 大流行相关的气候和空气质量指标的可视化分析平台。
Sci Total Environ. 2021 Jan 1;750:141424. doi: 10.1016/j.scitotenv.2020.141424. Epub 2020 Aug 4.
4
Diurnal and temporal changes in air pollution during COVID-19 strict lockdown over different regions of India.新冠疫情严格封控期间印度不同地区空气污染的日变化和时变化。
Environ Pollut. 2020 Nov;266(Pt 3):115368. doi: 10.1016/j.envpol.2020.115368. Epub 2020 Aug 13.
5
Evaluate Air Pollution by Promethee Ranking in Yangtze River Delta of China.中国长三角地区基于逼近理想解排序法的空气污染评估。
Int J Environ Res Public Health. 2020 Jan 16;17(2):587. doi: 10.3390/ijerph17020587.
6
Graphene-Modified ZnO Nanostructures for Low-Temperature NO Sensing.用于低温NO传感的石墨烯修饰的ZnO纳米结构
ACS Omega. 2019 Feb 26;4(2):4221-4232. doi: 10.1021/acsomega.8b03624. eCollection 2019 Feb 28.
7
Understanding the Influence of Crop Residue Burning on PM and PM Concentrations in China from 2013 to 2017 Using MODIS Data.利用 MODIS 数据理解 2013-2017 年中国作物秸秆燃烧对 PM 和 PM 浓度的影响。
Int J Environ Res Public Health. 2018 Jul 17;15(7):1504. doi: 10.3390/ijerph15071504.
8
Quantifying coal power plant responses to tighter SO emissions standards in China.量化中国更严格的二氧化硫排放标准对火力发电厂的影响。
Proc Natl Acad Sci U S A. 2018 Jul 3;115(27):7004-7009. doi: 10.1073/pnas.1800605115. Epub 2018 Jun 18.
[探索2015年12月北京严重雾霾:污染过程与排放变化]
Huan Jing Ke Xue. 2016 May 15;37(5):1593-601.
4
Air pollutant emissions from Chinese households: A major and underappreciated ambient pollution source.中国家庭的空气污染物排放:一个主要且未得到充分认识的环境污染源。
Proc Natl Acad Sci U S A. 2016 Jul 12;113(28):7756-61. doi: 10.1073/pnas.1604537113. Epub 2016 Jun 27.
5
Improving air pollution control policy in China--A perspective based on cost-benefit analysis.改善中国的空气污染控制政策——基于成本效益分析的视角。
Sci Total Environ. 2016 Feb 1;543(Pt A):307-314. doi: 10.1016/j.scitotenv.2015.11.037. Epub 2015 Nov 18.
6
Source apportionment and seasonal variation of PM2.5 carbonaceous aerosol in the Beijing-Tianjin-Hebei region of China.中国京津冀地区PM2.5含碳气溶胶的来源解析及季节变化
Environ Monit Assess. 2015 Mar;187(3):143. doi: 10.1007/s10661-015-4288-x. Epub 2015 Feb 26.
7
Will joint regional air pollution control be more cost-effective? An empirical study of China's Beijing-Tianjin-Hebei region.区域联合空气污染控制是否更具成本效益?对中国京津冀地区的实证研究。
J Environ Manage. 2015 Feb 1;149:27-36. doi: 10.1016/j.jenvman.2014.09.032. Epub 2014 Oct 21.
8
High secondary aerosol contribution to particulate pollution during haze events in China.中国霾事件中二次细粒子气溶胶对颗粒物污染的贡献。
Nature. 2014 Oct 9;514(7521):218-22. doi: 10.1038/nature13774. Epub 2014 Sep 17.
9
Inhalable microorganisms in Beijing's PM2.5 and PM10 pollutants during a severe smog event.严重雾霾事件期间北京PM2.5和PM10污染物中的可吸入微生物
Environ Sci Technol. 2014;48(3):1499-507. doi: 10.1021/es4048472. Epub 2014 Jan 23.
10
Impacts of temporary traffic control measures on vehicular emissions during the Asian games in Guangzhou, China.广州市亚运会期间临时交通管制措施对机动车排放的影响。
J Air Waste Manag Assoc. 2013 Jan;63(1):11-9. doi: 10.1080/10962247.2012.724041.