Department of Nephrology, University Medical Center Groningen, University of Groningen, PO Box 30.001, 9700 RB, Groningen, The Netherlands.
Department of Radiology, University Medical Center Groningen, University of Groningen, Groningen, The Netherlands.
Abdom Radiol (NY). 2018 May;43(5):1215-1222. doi: 10.1007/s00261-017-1285-2.
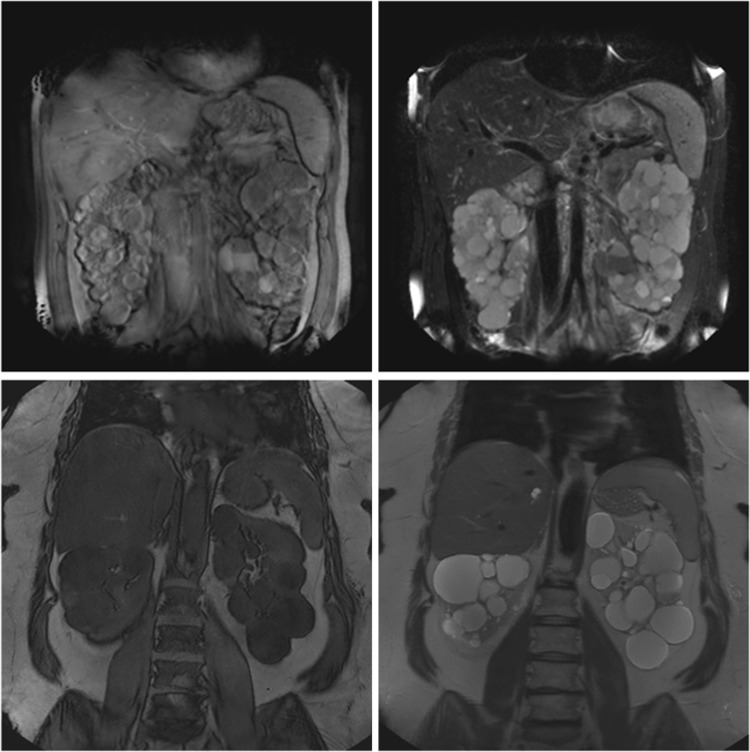
In ADPKD patients total kidney volume (TKV) measurement using MRI is performed to predict rate of disease progression. Historically T1 weighted images (T1) were used, but the methodology of T2 weighted imaging (T2) has evolved. We compared the performance of both sequences.
40 ADPKD patients underwent an abdominal MRI at baseline and follow-up. TKV was measured by manual tracing with Analyze Direct 11.0 software. Three readers established intra- and interreader coefficients of variation (CV). T1 and T2 measured kidney volumes and growth rates were compared with ICC and Bland-Altman analyses.
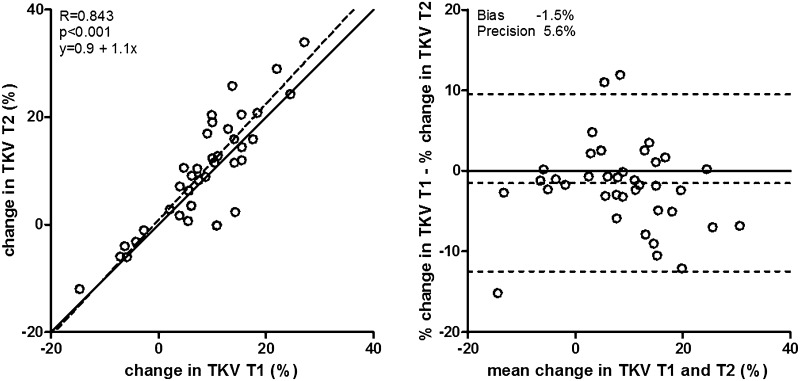
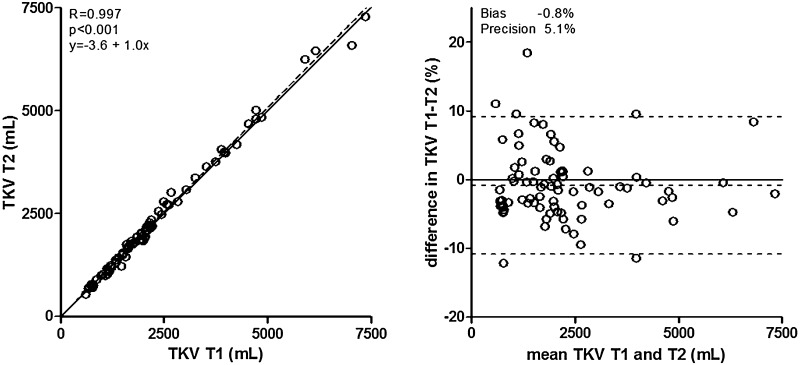
Participants were 49.7 ± 7.0 years of age, 55.0% female, with estimated GFR of 50.1 ± 11.5 mL/min/1.73 m. CVs were low and comparable for T2 and T1 (intrareader: 0.83% [0.48-1.79] vs. 1.15% [0.34-1.77], P = 0.9, interreader: 2.18% [1.59-2.61] vs. 1.69% [1.07-3.87], P = 0.9). TKV was clinically similar, but statistically significantly different between T2 and T1: 1867 [1172-2721] vs. 1932 [1180-2551] mL, respectively (P = 0.006), with a bias of only 0.8% and high agreement (ICC 0.997). Percentage kidney growth during 2.2 ± 0.3 years was similar for T2 and T1 (9.3 ± 10.6% vs. 7.8 ± 9.9%, P = 0.1, respectively), with a bias of 1.5% and high agreement (ICC 0.843). T2 was more often of sufficient quality for volume measurement (86.7% vs. 71.1%, P < 0.001).
In patients with ADPKD, measurement of kidney volume and growth rate performs similarly when using T2 compared to T1 weighted images, although T2 performs better on secondary outcome parameters; they are more often of sufficient quality for volume measurement and result in slightly lower intra- and interreader variability.
在 ADPKD 患者中,使用 MRI 测量总肾体积(TKV)以预测疾病进展速度。传统上使用 T1 加权图像(T1),但 T2 加权成像(T2)的方法已经演变。我们比较了这两种序列的性能。
40 名 ADPKD 患者在基线和随访时接受了腹部 MRI 检查。TKV 通过 Analyze Direct 11.0 软件进行手动追踪测量。三位读者建立了内部和读者间的变异系数(CV)。使用 ICC 和 Bland-Altman 分析比较 T1 和 T2 测量的肾脏体积和增长率。
参与者的年龄为 49.7±7.0 岁,55.0%为女性,估算肾小球滤过率为 50.1±11.5 mL/min/1.73 m。CV 较低且 T2 和 T1 相似(内部读者:0.83%[0.48-1.79]与 1.15%[0.34-1.77],P=0.9,外部读者:2.18%[1.59-2.61]与 1.69%[1.07-3.87],P=0.9)。TKV 在临床上相似,但 T2 和 T1 之间存在统计学上的显著差异:分别为 1867[1172-2721]和 1932[1180-2551]mL(P=0.006),仅存在 0.8%的偏差和高度一致性(ICC 0.997)。在 2.2±0.3 年期间,T2 和 T1 的肾脏生长百分比相似(分别为 9.3±10.6%和 7.8±9.9%,P=0.1),存在 1.5%的偏差和高度一致性(ICC 0.843)。T2 更常用于体积测量(86.7%与 71.1%,P<0.001)。
在 ADPKD 患者中,与 T1 加权图像相比,使用 T2 测量肾脏体积和生长速度的性能相似,尽管 T2 在次要结果参数上表现更好;它们更常用于体积测量,并且导致内部和读者间的变异更小。