Hernaningsih Yetti, Akualing Jeine Stela
Department of Clinical Pathology, Faculty of Medicine Universitas Airlangga, Dr. Soetomo General Hospital, Surabaya, Jawa Timur Clinical Pathology Laboratory, Tobelo General Hospital, North Halmahera, Indonesia.
Medicine (Baltimore). 2017 Sep;96(38):e7976. doi: 10.1097/MD.0000000000007976.
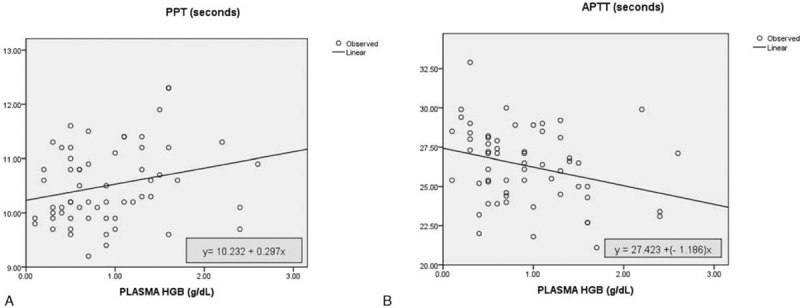
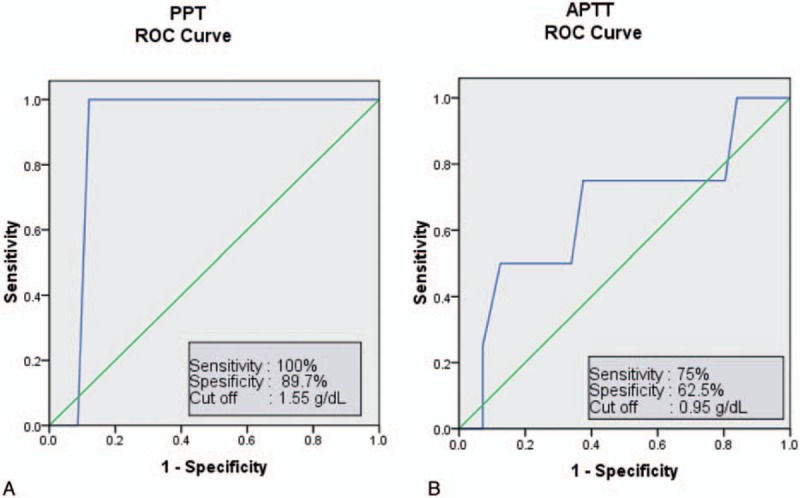
Hemolysis is the most common reason why coagulation test samples are rejected. However, the effects of hemolysis on plasma prothrombin time (PPT) and activated partial thromboplastin time (APTT) are rarely investigated and the results are controversial. This research aims to analyze the effects of hemolysis on PPT and APPT using the photo-optical method.Nonhemolyzed citrate blood samples (n = 30) with normal PPT and APTT underwent 2-step mechanical lysis and then hemoglobin level measurement was carried out at each step. The first lysis was mild to moderate resulting in a hemoglobin level of <0.8 g/dL. These samples were labeled as group 1. The second step showed more severe lysis, which resulted in a plasma hemoglobin level of ≥0.8 g/dL. These samples were labeled as group 2. Analysis was carried out on the PPT and APTT differences between the 2 groups and baseline, as well as between group 1 and group 2 using repeated-measures analysis of variance (ANOVA). The effects of hemolysis were analyzed using linear regression. Receiver operating characteristic (ROC) curve analysis was performed to determine the cut-off value in PPT and APTT.Significantly shorter APTT was measured for group 1 than baseline, (P = .000), group 2 than baseline (P = .000), and group 2 than group 1 (P = .003). With regard to PPT results, those for group 1 were significant shorter than baseline (P = .002), while those for group 2 were significantly longer than group 1 (P = .000). In the correlation assay, the level of hemolysis revealed a mildly significant correlation to APTT (R = 0.245; P = .02). Cut-off value for PPT was 1.55 g/dL (100% sensitivity and 87.9% specificity), while the value for APTT was 0.95 g/dL (75% sensitivity and 62.5% specificity).Not all hemolyzed samples should be rejected for PPT and APTT tests using photo-optical methods.
溶血是凝血检测样本被拒收的最常见原因。然而,溶血对血浆凝血酶原时间(PPT)和活化部分凝血活酶时间(APTT)的影响很少被研究,且结果存在争议。本研究旨在采用光光学方法分析溶血对PPT和APTT的影响。对PPT和APTT正常的非溶血枸橼酸盐血样(n = 30)进行两步机械溶血,然后在每一步进行血红蛋白水平测量。第一步溶血为轻度至中度,血红蛋白水平<0.8 g/dL。这些样本标记为第1组。第二步溶血更严重,血浆血红蛋白水平≥0.8 g/dL。这些样本标记为第2组。使用重复测量方差分析(ANOVA)对两组与基线之间以及第1组和第2组之间的PPT和APTT差异进行分析。使用线性回归分析溶血的影响。进行受试者工作特征(ROC)曲线分析以确定PPT和APTT的临界值。第1组的APTT测量值显著短于基线(P = 0.000)、第2组短于基线(P = 0.000)以及第2组短于第1组(P = 0.003)。关于PPT结果,第1组显著短于基线(P = 0.002),而第2组显著长于第1组(P = 0.000)。在相关性分析中,溶血水平与APTT呈轻度显著相关(R = 0.245;P = 0.02)。PPT的临界值为1.55 g/dL(灵敏度100%,特异性87.9%),而APTT的临界值为0.95 g/dL(灵敏度75%,特异性62.5%)。并非所有溶血样本都应因采用光光学方法进行PPT和APTT检测而被拒收。