• 文献检索
  • 文档翻译
  • 深度研究
  • 学术资讯
  • Suppr Zotero 插件Zotero 插件
  • 邀请有礼
  • 套餐&价格
  • 历史记录
应用&插件
Suppr Zotero 插件Zotero 插件浏览器插件Mac 客户端Windows 客户端微信小程序
定价
高级版会员购买积分包购买API积分包
服务
文献检索文档翻译深度研究API 文档MCP 服务
关于我们
关于 Suppr公司介绍联系我们用户协议隐私条款
关注我们

Suppr 超能文献

核心技术专利:CN118964589B侵权必究
粤ICP备2023148730 号-1Suppr @ 2026

文献检索

告别复杂PubMed语法,用中文像聊天一样搜索,搜遍4000万医学文献。AI智能推荐,让科研检索更轻松。

立即免费搜索

文件翻译

保留排版,准确专业,支持PDF/Word/PPT等文件格式,支持 12+语言互译。

免费翻译文档

深度研究

AI帮你快速写综述,25分钟生成高质量综述,智能提取关键信息,辅助科研写作。

立即免费体验

利用哨兵-1A和陆地卫星-8数据绘制中国鄱阳湖平原早、中、晚稻种植范围图

Mapping Early, Middle and Late Rice Extent Using Sentinel-1A and Landsat-8 Data in the Poyang Lake Plain, China.

作者信息

Tian Haifeng, Wu Mingquan, Wang Li, Niu Zheng

机构信息

The State Key Laboratory of Remote Sensing Science, Jointly Sponsored by Institute of Remote Sensing and Digital Earth of Chinese Academy of Sciences and Beijing Normal University, P.O. Box 9718, Datun Road, Chaoyang, Beijing 100101, China.

College of Resource and Environment, University of Chinese Academy of Sciences, Yuquan Road 19, Shijingshan, Beijing 100049, China.

出版信息

Sensors (Basel). 2018 Jan 11;18(1):185. doi: 10.3390/s18010185.

DOI:10.3390/s18010185
PMID:29324647
原文链接:https://pmc.ncbi.nlm.nih.gov/articles/PMC5795514/
Abstract

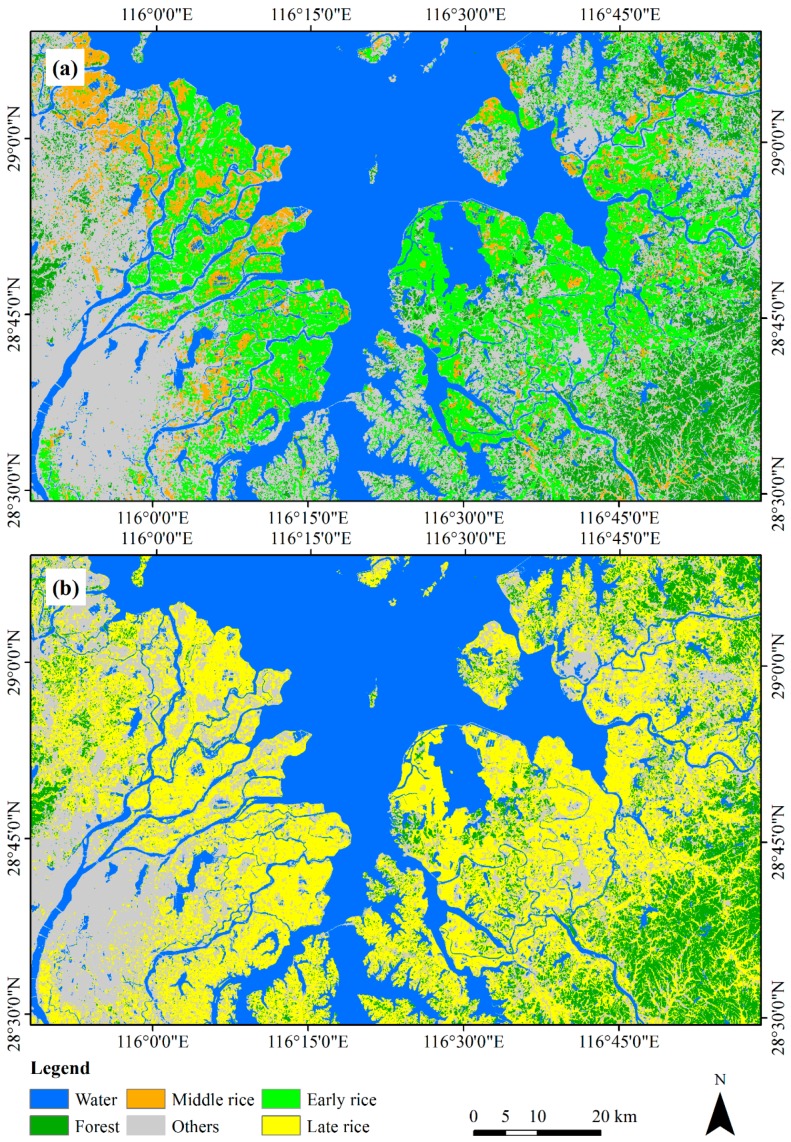
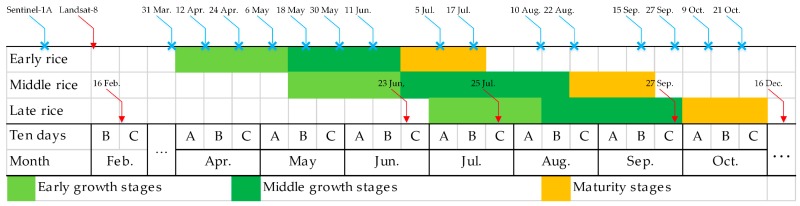
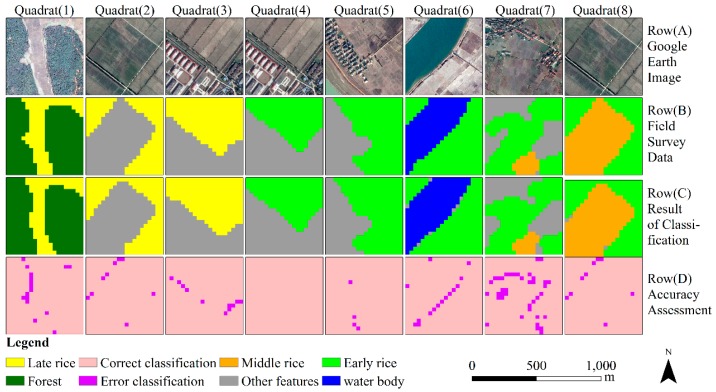
Areas and spatial distribution information of paddy rice are important for managing food security, water use, and climate change. However, there are many difficulties in mapping paddy rice, especially mapping multi-season paddy rice in rainy regions, including differences in phenology, the influence of weather, and farmland fragmentation. To resolve these problems, a novel multi-season paddy rice mapping approach based on Sentinel-1A and Landsat-8 data is proposed. First, Sentinel-1A data were enhanced based on the fact that the backscattering coefficient of paddy rice varies according to its growth stage. Second, cropland information was enhanced based on the fact that the NDVI of cropland in winter is lower than that in the growing season. Then, paddy rice and cropland areas were extracted using a K-Means unsupervised classifier with enhanced images. Third, to further improve the paddy rice classification accuracy, cropland information was utilized to optimize distribution of paddy rice by the fact that paddy rice must be planted in cropland. Classification accuracy was validated based on ground-data from 25 field survey quadrats measuring 600 m × 600 m. The results show that: multi-season paddy rice planting areas effectively was extracted by the method and adjusted early rice area of 1630.84 km², adjusted middle rice area of 556.21 km², and adjusted late rice area of 3138.37 km². The overall accuracy was 98.10%, with a kappa coefficient of 0.94.

摘要

水稻的面积和空间分布信息对于管理粮食安全、水资源利用和气候变化至关重要。然而,绘制水稻分布图存在许多困难,尤其是在多雨地区绘制多季水稻分布图,包括物候差异、天气影响和农田碎片化等问题。为了解决这些问题,提出了一种基于哨兵 - 1A 和陆地卫星 - 8 数据的新型多季水稻制图方法。首先,基于水稻后向散射系数随生长阶段变化的事实对哨兵 - 1A 数据进行增强。其次,基于冬季农田的归一化植被指数低于生长季节这一事实增强农田信息。然后,使用 K - 均值无监督分类器对增强后的图像提取水稻和农田面积。第三,为进一步提高水稻分类精度,利用农田信息,基于水稻必须种植在农田这一事实优化水稻分布。基于来自 25 个 600 m×600 m 实地调查样方的地面数据验证分类精度。结果表明:该方法有效提取了多季水稻种植面积,早稻面积调整为 1630.84 km²,中稻面积调整为 556.21 km²,晚稻面积调整为 3138.37 km²。总体精度为 98.10%,kappa 系数为 0.94。

https://cdn.ncbi.nlm.nih.gov/pmc/blobs/b150/5795514/ddf43f7182e6/sensors-18-00185-g009.jpg
https://cdn.ncbi.nlm.nih.gov/pmc/blobs/b150/5795514/ea950967d157/sensors-18-00185-g001.jpg
https://cdn.ncbi.nlm.nih.gov/pmc/blobs/b150/5795514/e65fe7e3f1e2/sensors-18-00185-g002.jpg
https://cdn.ncbi.nlm.nih.gov/pmc/blobs/b150/5795514/db6249a253f4/sensors-18-00185-g003.jpg
https://cdn.ncbi.nlm.nih.gov/pmc/blobs/b150/5795514/511beb4ba339/sensors-18-00185-g004.jpg
https://cdn.ncbi.nlm.nih.gov/pmc/blobs/b150/5795514/7777ad2feb7e/sensors-18-00185-g005.jpg
https://cdn.ncbi.nlm.nih.gov/pmc/blobs/b150/5795514/5e3bf47bfab1/sensors-18-00185-g006.jpg
https://cdn.ncbi.nlm.nih.gov/pmc/blobs/b150/5795514/7a7117766335/sensors-18-00185-g007.jpg
https://cdn.ncbi.nlm.nih.gov/pmc/blobs/b150/5795514/aabff050668d/sensors-18-00185-g008.jpg
https://cdn.ncbi.nlm.nih.gov/pmc/blobs/b150/5795514/ddf43f7182e6/sensors-18-00185-g009.jpg

相似文献

1
Mapping Early, Middle and Late Rice Extent Using Sentinel-1A and Landsat-8 Data in the Poyang Lake Plain, China.利用哨兵-1A和陆地卫星-8数据绘制中国鄱阳湖平原早、中、晚稻种植范围图
Sensors (Basel). 2018 Jan 11;18(1):185. doi: 10.3390/s18010185.
2
Mapping paddy rice planting area in wheat-rice double-cropped areas through integration of Landsat-8 OLI, MODIS, and PALSAR images.通过整合陆地卫星8号OLI、中分辨率成像光谱仪(MODIS)和先进陆地观测卫星雷达(PALSAR)图像绘制稻麦两熟地区的水稻种植面积
Sci Rep. 2015 May 12;5:10088. doi: 10.1038/srep10088.
3
Mapping paddy rice planting area in rice-wetland coexistent areas through analysis of Landsat 8 OLI and MODIS images.通过分析陆地卫星8号OLI和中分辨率成像光谱仪(MODIS)图像绘制水稻-湿地共存区域的水稻种植面积
Int J Appl Earth Obs Geoinf. 2016 Apr;46:1-12. doi: 10.1016/j.jag.2015.11.001. Epub 2015 Nov 28.
4
Mapping paddy rice planting area in northeastern Asia with Landsat 8 images, phenology-based algorithm and Google Earth Engine.利用Landsat 8影像、基于物候的算法和谷歌地球引擎绘制东北亚水稻种植面积图。
Remote Sens Environ. 2016 Nov;185:142-154. doi: 10.1016/j.rse.2016.02.016. Epub 2016 Mar 2.
5
Mapping paddy rice planting area in cold temperate climate region through analysis of time series Landsat 8 (OLI), Landsat 7 (ETM+) and MODIS imagery.通过分析Landsat 8(OLI)、Landsat 7(ETM+)和MODIS影像时间序列来绘制寒温带气候区的水稻种植面积。
ISPRS J Photogramm Remote Sens. 2015 Jul;105:220-233. doi: 10.1016/j.isprsjprs.2015.04.008. Epub 2015 May 4.
6
Mapping paddy rice distribution using multi-temporal Landsat imagery in the Sanjiang Plain, northeast China.利用多时相陆地卫星影像绘制中国东北三江平原的水稻分布
Front Earth Sci. 2016 Mar;10(1):49-62. doi: 10.1007/s11707-015-0518-3. Epub 2015 Jul 28.
7
Automatic and adaptive paddy rice mapping using Landsat images: Case study in Songnen Plain in Northeast China.利用 Landsat 图像进行自动和自适应的水稻田制图:以中国东北松嫩平原为例。
Sci Total Environ. 2017 Nov 15;598:581-592. doi: 10.1016/j.scitotenv.2017.03.221. Epub 2017 Apr 25.
8
Spatiotemporal patterns of paddy rice croplands in China and India from 2000 to 2015.2000-2015 年中国和印度水稻种植区的时空格局。
Sci Total Environ. 2017 Feb 1;579:82-92. doi: 10.1016/j.scitotenv.2016.10.223. Epub 2016 Nov 17.
9
Mapping Winter Wheat with Multi-Temporal SAR and Optical Images in an Urban Agricultural Region.利用多时相合成孔径雷达和光学图像对城市农业区域的冬小麦进行测绘
Sensors (Basel). 2017 May 25;17(6):1210. doi: 10.3390/s17061210.
10
Using of Multi-Source and Multi-Temporal Remote Sensing Data Improves Crop-Type Mapping in the Subtropical Agriculture Region.多源多时相遥感数据的使用提高了亚热带农业区的作物类型制图精度。
Sensors (Basel). 2019 May 26;19(10):2401. doi: 10.3390/s19102401.

引用本文的文献

1
Tracking and analyzing the spatio-temporal changes of rice planting structure in Poyang Lake using multi-model fusion method with sentinel-2 multi temporal data.利用哨兵-2多时态数据的多模型融合方法跟踪和分析鄱阳湖水稻种植结构的时空变化。
PLoS One. 2025 Apr 7;20(4):e0320781. doi: 10.1371/journal.pone.0320781. eCollection 2025.
2
Research on Rice Fields Extraction by NDVI Difference Method Based on Sentinel Data.基于 Sentinel 数据的 NDVI 差值法稻田提取研究。
Sensors (Basel). 2023 Jun 25;23(13):5876. doi: 10.3390/s23135876.
3
Food Security in China: A Brief View of Rice Production in Recent 20 Years.

本文引用的文献

1
Mapping paddy rice planting area in northeastern Asia with Landsat 8 images, phenology-based algorithm and Google Earth Engine.利用Landsat 8影像、基于物候的算法和谷歌地球引擎绘制东北亚水稻种植面积图。
Remote Sens Environ. 2016 Nov;185:142-154. doi: 10.1016/j.rse.2016.02.016. Epub 2016 Mar 2.
2
Mapping paddy rice planting area in wheat-rice double-cropped areas through integration of Landsat-8 OLI, MODIS, and PALSAR images.通过整合陆地卫星8号OLI、中分辨率成像光谱仪(MODIS)和先进陆地观测卫星雷达(PALSAR)图像绘制稻麦两熟地区的水稻种植面积
Sci Rep. 2015 May 12;5:10088. doi: 10.1038/srep10088.
3
Application of remote sensors in mapping rice area and forecasting its production: a review.
中国的粮食安全:近20年水稻生产简述
Foods. 2022 Oct 23;11(21):3324. doi: 10.3390/foods11213324.
4
Optimal Bands Combination Selection for Extracting Garlic Planting Area with Multi-Temporal Sentinel-2 Imagery.利用多时相 Sentinel-2 影像提取大蒜种植区的最佳波段组合选择。
Sensors (Basel). 2021 Aug 18;21(16):5556. doi: 10.3390/s21165556.
5
High Spatiotemporal Resolution Mapping of Surface Water in the Southwest Poyang Lake and Its Responses to Climate Oscillations.鄱阳湖西南部地表水的高时空分辨率制图及其对气候振荡的响应
Sensors (Basel). 2020 Aug 28;20(17):4872. doi: 10.3390/s20174872.
遥感技术在水稻种植面积测绘与产量预测中的应用综述
Sensors (Basel). 2015 Jan 5;15(1):769-91. doi: 10.3390/s150100769.
4
Automatic classification of canine PRG neuronal discharge patterns using K-means clustering.使用K均值聚类对犬类PRG神经元放电模式进行自动分类。
Respir Physiol Neurobiol. 2015 Feb 1;207:28-39. doi: 10.1016/j.resp.2014.11.016. Epub 2014 Dec 12.
5
Rice by the numbers: A good grain.数据中的大米:一种优质谷物。
Nature. 2014 Oct 30;514(7524):S50-1. doi: 10.1038/514s50a.
6
What it will take to feed 5.0 billion rice consumers in 2030.2030年养活50亿大米消费者需要付出什么。
Plant Mol Biol. 2005 Sep;59(1):1-6. doi: 10.1007/s11103-005-2159-5.
7
Photosynthate allocations in rice plants: food production or atmospheric methane?水稻植株中的光合产物分配:用于粮食生产还是产生大气甲烷?
Proc Natl Acad Sci U S A. 2002 Sep 17;99(19):11993-5. doi: 10.1073/pnas.202483599. Epub 2002 Sep 9.