Science and Engineering Faculty, Queensland University of Technology, Queensland, Australia.
PLoS One. 2018 Mar 1;13(3):e0193345. doi: 10.1371/journal.pone.0193345. eCollection 2018.
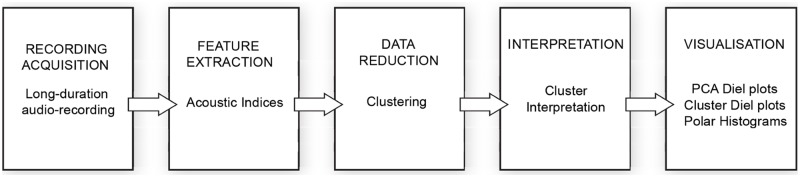
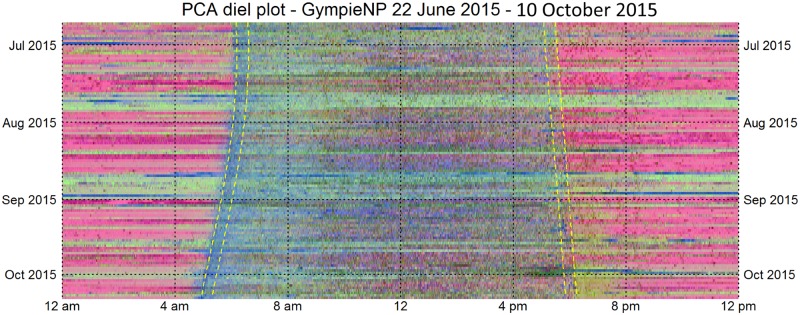
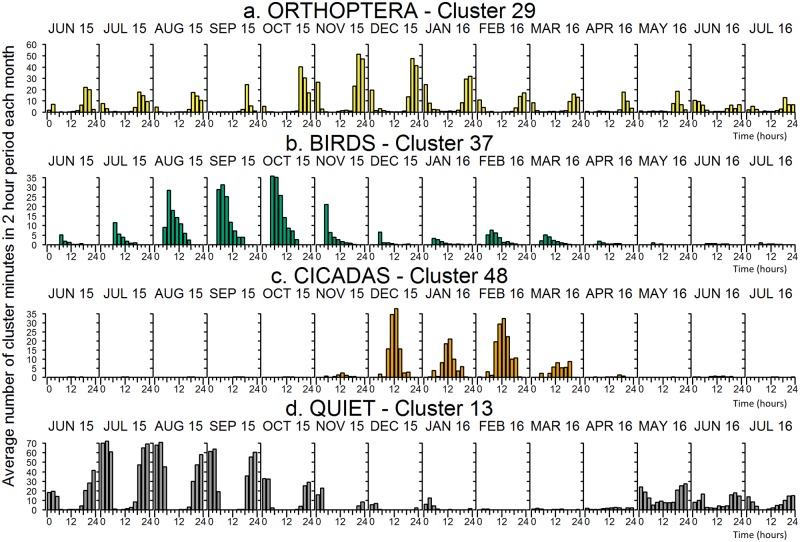
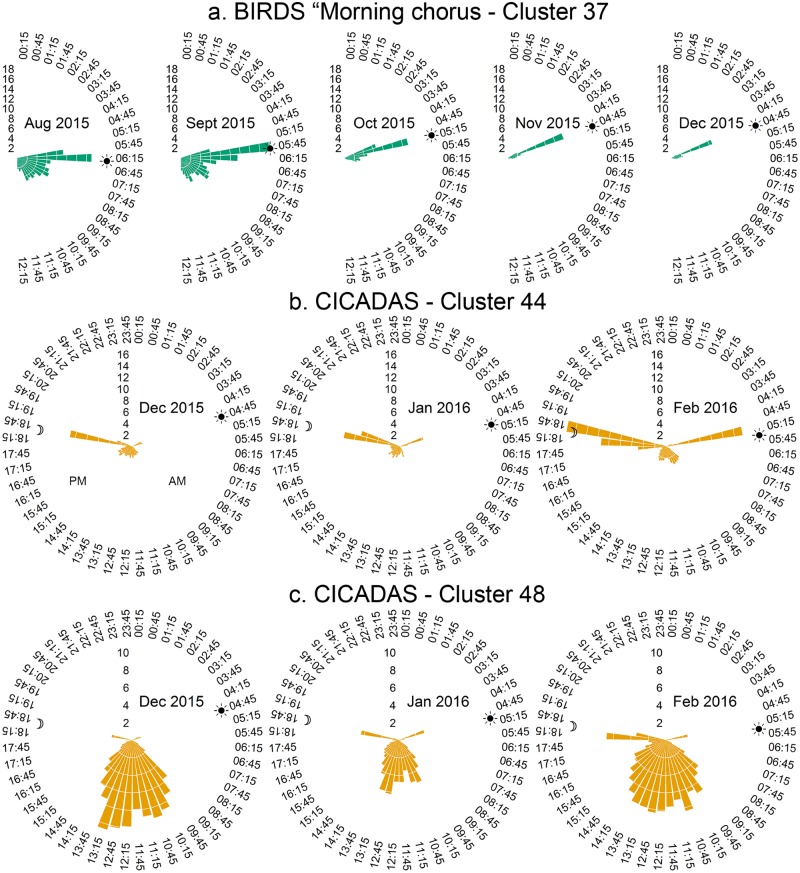
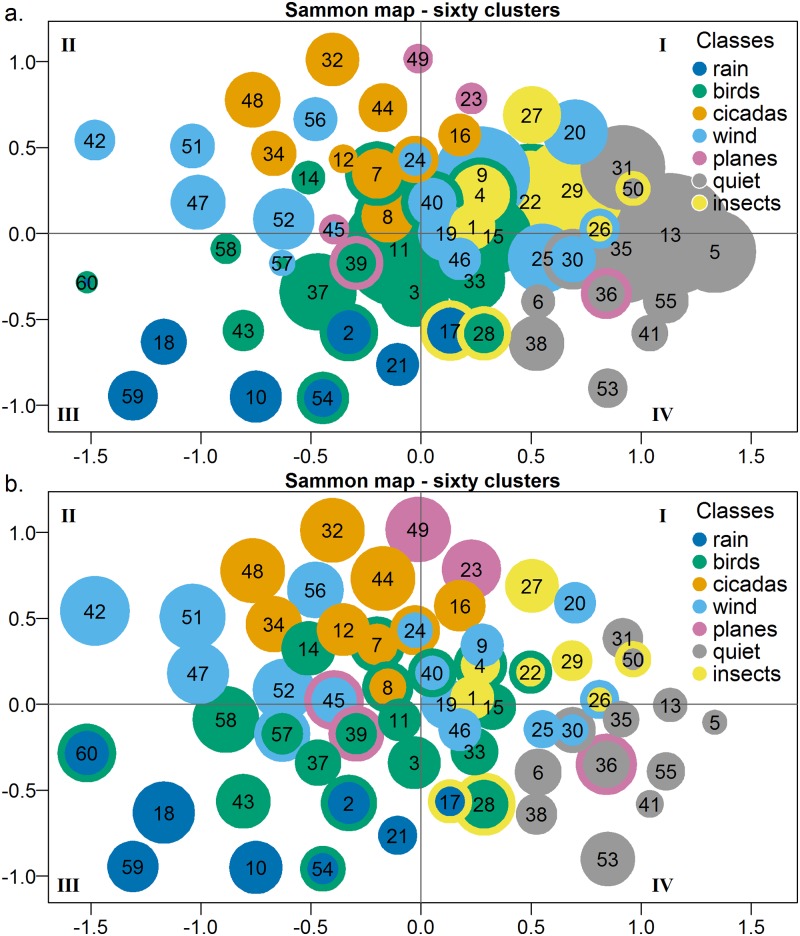
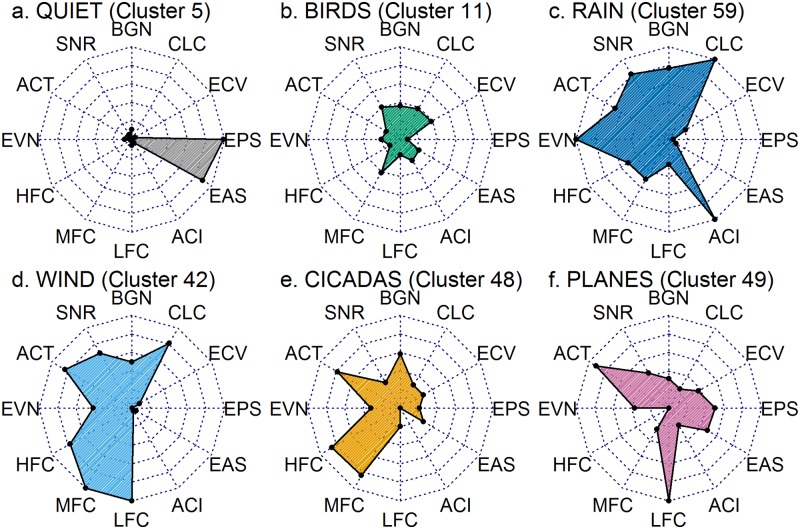
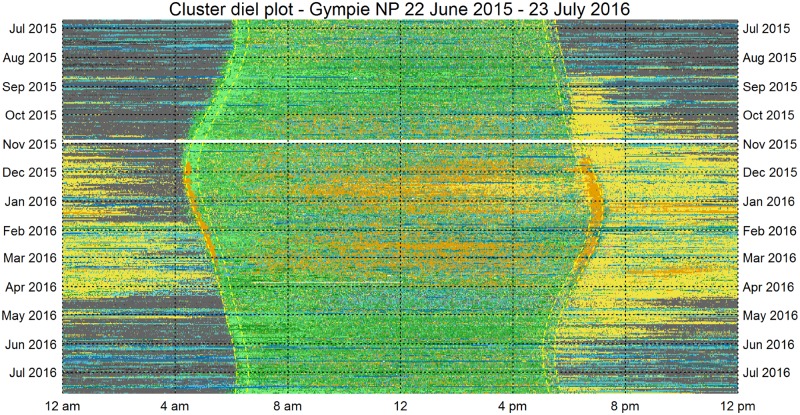
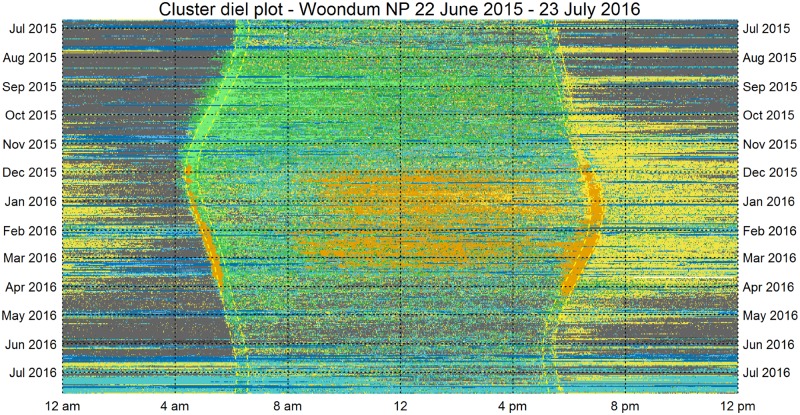
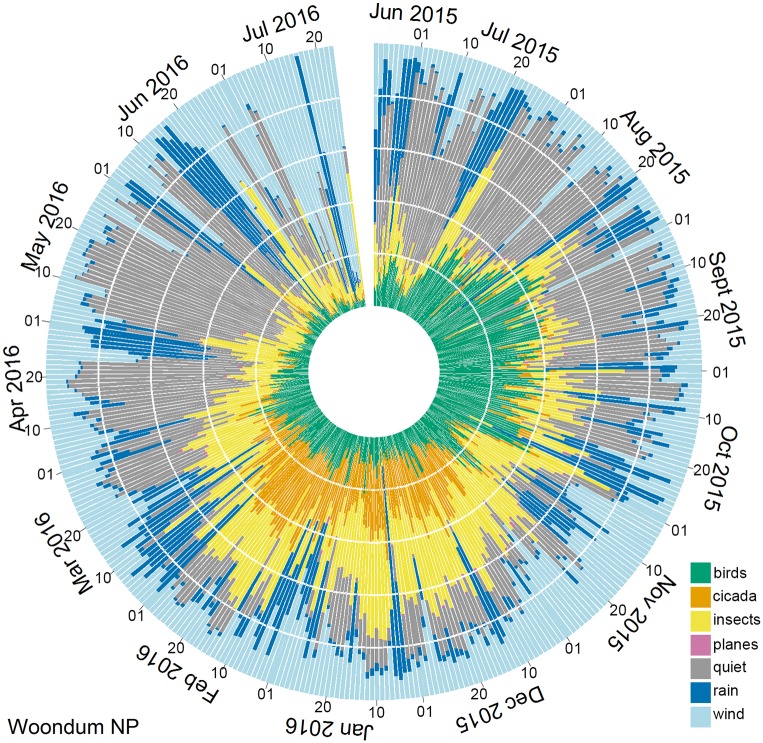
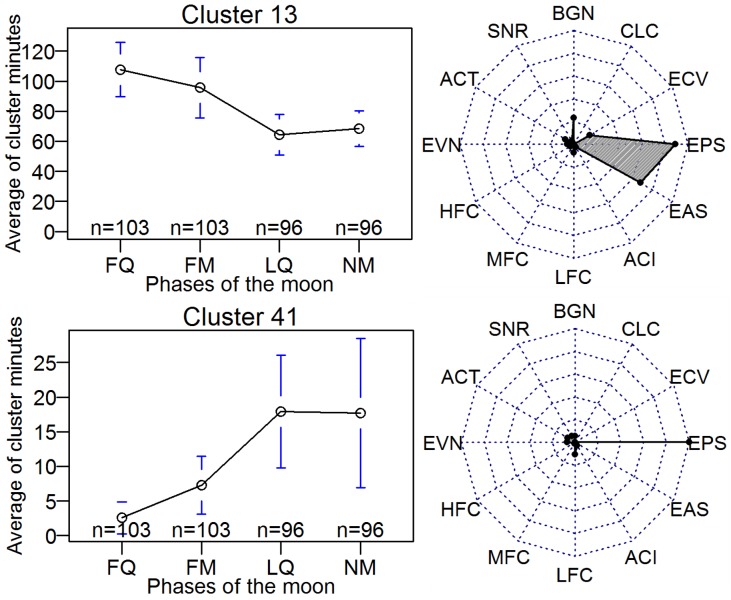
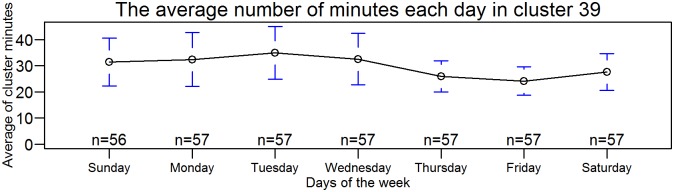
Audio recordings of the environment are an increasingly important technique to monitor biodiversity and ecosystem function. While the acquisition of long-duration recordings is becoming easier and cheaper, the analysis and interpretation of that audio remains a significant research area. The issue addressed in this paper is the automated reduction of environmental audio data to facilitate ecological investigations. We describe a method that first reduces environmental audio to vectors of acoustic indices, which are then clustered. This can reduce the audio data by six to eight orders of magnitude yet retain useful ecological information. We describe techniques to visualise sequences of cluster occurrence (using for example, diel plots, rose plots) that assist interpretation of environmental audio. Colour coding acoustic clusters allows months and years of audio data to be visualised in a single image. These techniques are useful in identifying and indexing the contents of long-duration audio recordings. They could also play an important role in monitoring long-term changes in species abundance brought about by habitat degradation and/or restoration.
环境音频记录是监测生物多样性和生态系统功能的一种越来越重要的技术。虽然长时间录制的获取变得更加容易和便宜,但音频的分析和解释仍然是一个重要的研究领域。本文解决的问题是自动减少环境音频数据,以方便生态调查。我们描述了一种首先将环境音频降低为声学指数向量,然后对其进行聚类的方法。这可以将音频数据减少六个到八个数量级,但仍保留有用的生态信息。我们描述了可视化聚类发生序列的技术(例如,使用日变化图、玫瑰图),以帮助解释环境音频。对声学聚类进行颜色编码可以将数月和数年的音频数据在单个图像中可视化。这些技术在识别和索引长时间录音的内容方面非常有用。它们在监测由于栖息地退化和/或恢复而导致的物种数量长期变化方面也可能发挥重要作用。