Department of Climatology, Faculty of Geographical and Geological Sciences, Adam Mickiewicz University, Krygowskiego 10, 61 680, Poznań, Poland.
Space Informatics Lab, Department of Geography and GIS, University of Cincinnati, 219 Braunstein Hall, Cincinnati, OH, 45221, USA.
Int J Biometeorol. 2018 Jul;62(7):1297-1309. doi: 10.1007/s00484-018-1534-2. Epub 2018 Apr 11.
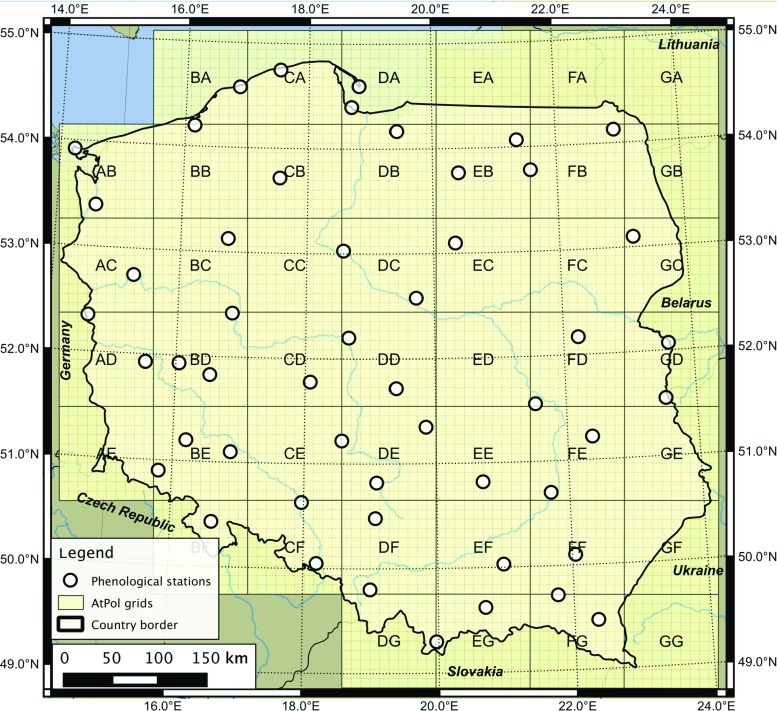
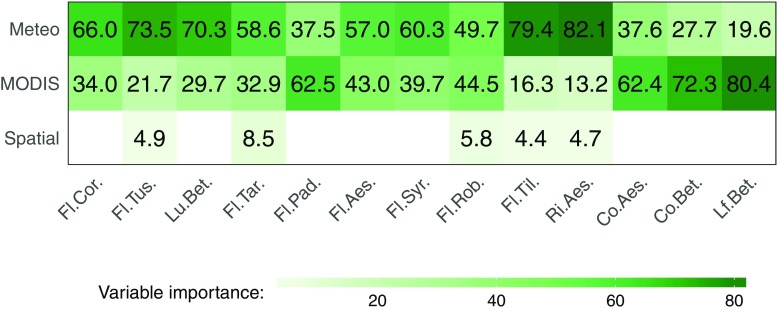
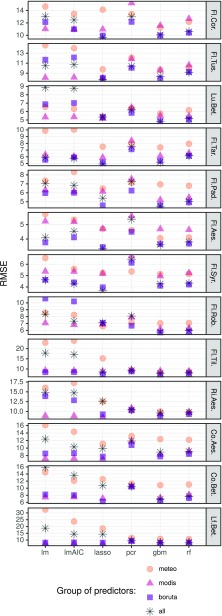
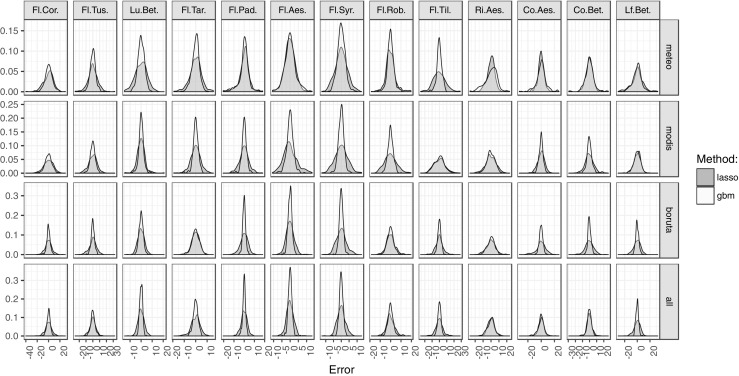
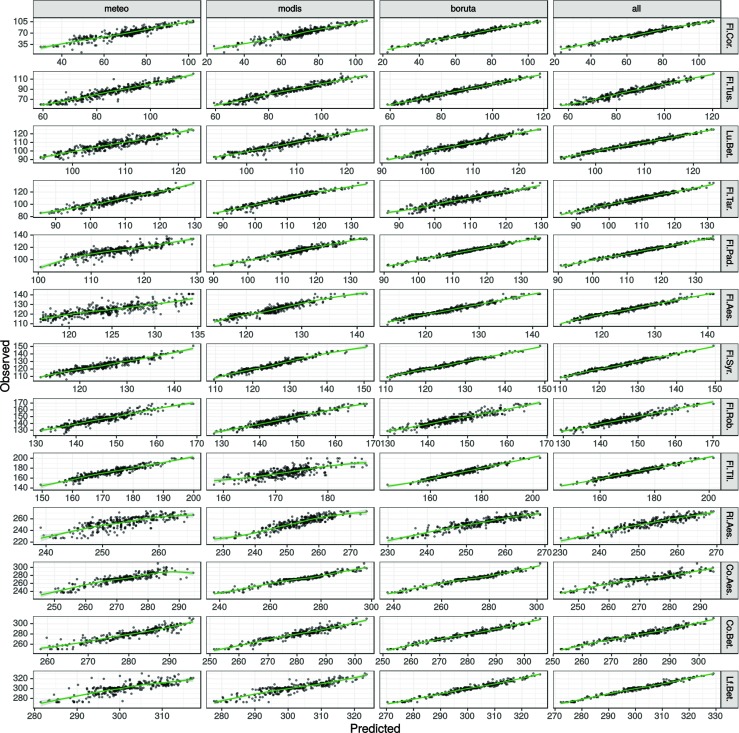
Changes in the timing of plant phenological phases are important proxies in contemporary climate research. However, most of the commonly used traditional phenological observations do not give any coherent spatial information. While consistent spatial data can be obtained from airborne sensors and preprocessed gridded meteorological data, not many studies robustly benefit from these data sources. Therefore, the main aim of this study is to create and evaluate different statistical models for reconstructing, predicting, and improving quality of phenological phases monitoring with the use of satellite and meteorological products. A quality-controlled dataset of the 13 BBCH plant phenophases in Poland was collected for the period 2007-2014. For each phenophase, statistical models were built using the most commonly applied regression-based machine learning techniques, such as multiple linear regression, lasso, principal component regression, generalized boosted models, and random forest. The quality of the models was estimated using a k-fold cross-validation. The obtained results showed varying potential for coupling meteorological derived indices with remote sensing products in terms of phenological modeling; however, application of both data sources improves models' accuracy from 0.6 to 4.6 day in terms of obtained RMSE. It is shown that a robust prediction of early phenological phases is mostly related to meteorological indices, whereas for autumn phenophases, there is a stronger information signal provided by satellite-derived vegetation metrics. Choosing a specific set of predictors and applying a robust preprocessing procedures is more important for final results than the selection of a particular statistical model. The average RMSE for the best models of all phenophases is 6.3, while the individual RMSE vary seasonally from 3.5 to 10 days. Models give reliable proxy for ground observations with RMSE below 5 days for early spring and late spring phenophases. For other phenophases, RMSE are higher and rise up to 9-10 days in the case of the earliest spring phenophases.
物候阶段时间变化是当代气候研究中的重要指标。然而,大多数常用的传统物候观测方法都没有提供连贯的空间信息。虽然可以从机载传感器和预处理的网格化气象数据中获得一致的空间数据,但很少有研究从这些数据源中获得稳健的收益。因此,本研究的主要目的是创建和评估不同的统计模型,以利用卫星和气象产品来重建、预测和改进物候阶段监测的质量。本研究收集了 2007 年至 2014 年期间波兰 13 个 BBCH 物候阶段的质量控制数据集。对于每个物候阶段,使用最常用的基于回归的机器学习技术,如多元线性回归、套索、主成分回归、广义增强模型和随机森林,构建了统计模型。使用 k 折交叉验证评估模型的质量。结果表明,在物候建模方面,将气象衍生指数与遥感产品结合具有不同的潜力;然而,同时使用这两种数据源可以将模型的精度从 6 天提高到 4.6 天,均方根误差降低。结果表明,早期物候阶段的稳健预测主要与气象指数有关,而对于秋季物候阶段,卫星衍生的植被指标提供了更强的信息信号。与选择特定的统计模型相比,选择特定的预测因子集和应用稳健的预处理程序对最终结果更为重要。所有物候阶段最佳模型的平均均方根误差为 6.3,而个别物候阶段的均方根误差季节性变化从 3.5 天到 10 天不等。对于早春和晚春物候阶段,模型的均方根误差低于 5 天,可为地面观测提供可靠的替代。对于其他物候阶段,均方根误差较高,在最早的春季物候阶段上升到 9-10 天。