• 文献检索
  • 文档翻译
  • 深度研究
  • 学术资讯
  • Suppr Zotero 插件Zotero 插件
  • 邀请有礼
  • 套餐&价格
  • 历史记录
应用&插件
Suppr Zotero 插件Zotero 插件浏览器插件Mac 客户端Windows 客户端微信小程序
定价
高级版会员购买积分包购买API积分包
服务
文献检索文档翻译深度研究API 文档MCP 服务
关于我们
关于 Suppr公司介绍联系我们用户协议隐私条款
关注我们

Suppr 超能文献

核心技术专利:CN118964589B侵权必究
粤ICP备2023148730 号-1Suppr @ 2026

文献检索

告别复杂PubMed语法,用中文像聊天一样搜索,搜遍4000万医学文献。AI智能推荐,让科研检索更轻松。

立即免费搜索

文件翻译

保留排版,准确专业,支持PDF/Word/PPT等文件格式,支持 12+语言互译。

免费翻译文档

深度研究

AI帮你快速写综述,25分钟生成高质量综述,智能提取关键信息,辅助科研写作。

立即免费体验

自动组织微阵列解阵列的强大图像分析(ATMAD)。

ATMAD: robust image analysis for Automatic Tissue MicroArray De-arraying.

机构信息

Inria Rennes - Bretagne Atlantique, Campus universitaire de Beaulieu, Rennes, 35042, France.

Innopsys, Parc d'Activités Activestre, Carbonne, 31390, France.

出版信息

BMC Bioinformatics. 2018 Apr 19;19(1):148. doi: 10.1186/s12859-018-2111-8.

DOI:10.1186/s12859-018-2111-8
PMID:29673310
原文链接:https://pmc.ncbi.nlm.nih.gov/articles/PMC5909283/
Abstract

BACKGROUND

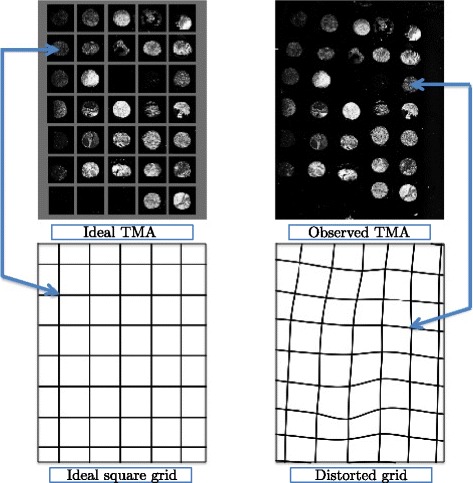
Over the last two decades, an innovative technology called Tissue Microarray (TMA), which combines multi-tissue and DNA microarray concepts, has been widely used in the field of histology. It consists of a collection of several (up to 1000 or more) tissue samples that are assembled onto a single support - typically a glass slide - according to a design grid (array) layout, in order to allow multiplex analysis by treating numerous samples under identical and standardized conditions. However, during the TMA manufacturing process, the sample positions can be highly distorted from the design grid due to the imprecision when assembling tissue samples and the deformation of the embedding waxes. Consequently, these distortions may lead to severe errors of (histological) assay results when the sample identities are mismatched between the design and its manufactured output. The development of a robust method for de-arraying TMA, which localizes and matches TMA samples with their design grid, is therefore crucial to overcome the bottleneck of this prominent technology.

RESULTS

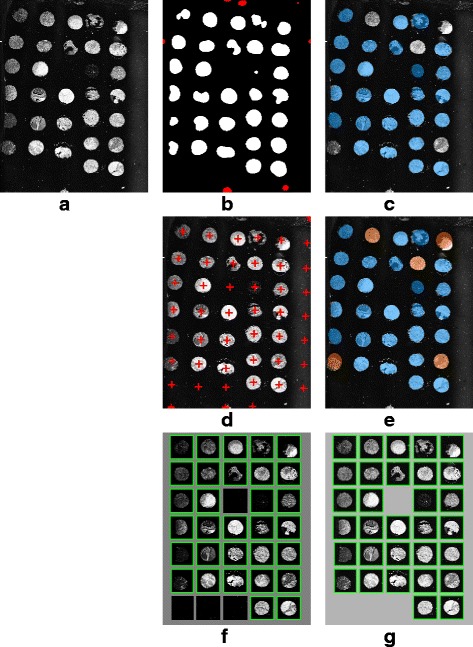
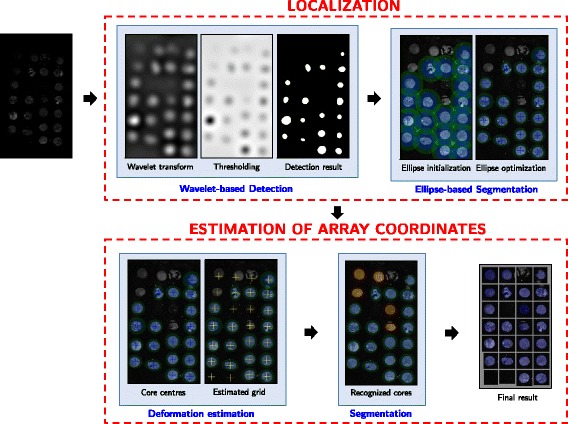
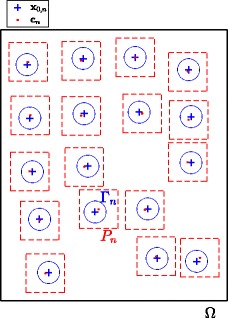
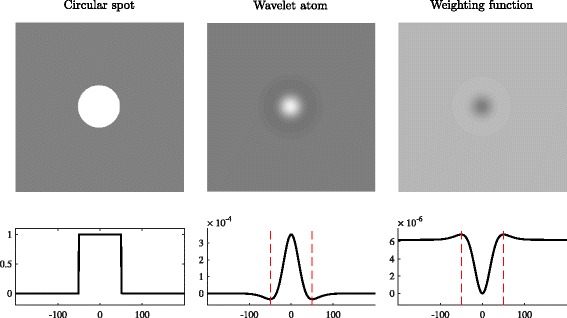
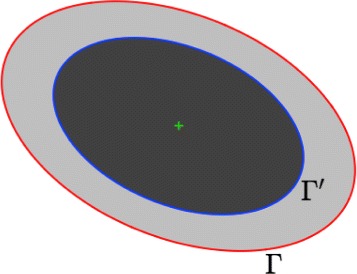
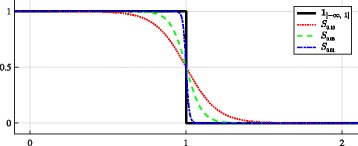
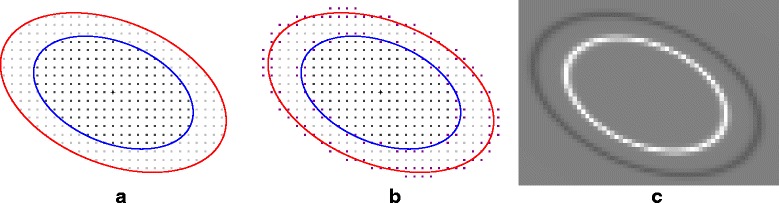
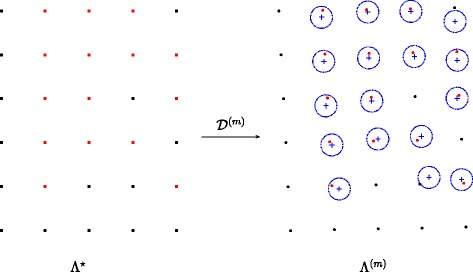
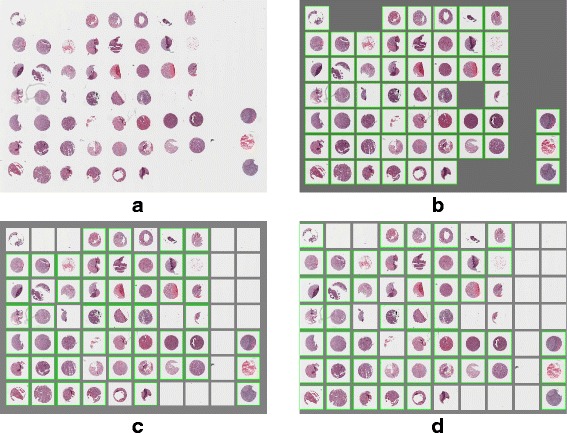
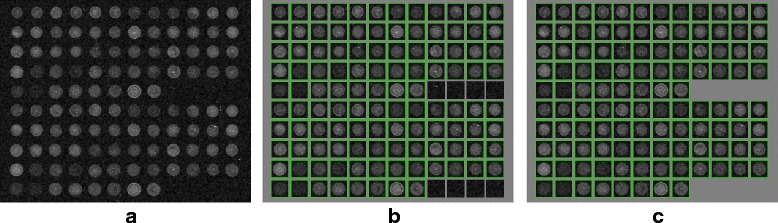
In this paper, we propose an Automatic, fast and robust TMA De-arraying (ATMAD) approach dedicated to images acquired with brightfield and fluorescence microscopes (or scanners). First, tissue samples are localized in the large image by applying a locally adaptive thresholding on the isotropic wavelet transform of the input TMA image. To reduce false detections, a parametric shape model is considered for segmenting ellipse-shaped objects at each detected position. Segmented objects that do not meet the size and the roundness criteria are discarded from the list of tissue samples before being matched with the design grid. Sample matching is performed by estimating the TMA grid deformation under the thin-plate model. Finally, thanks to the estimated deformation, the true tissue samples that were preliminary rejected in the early image processing step are recognized by running a second segmentation step.

CONCLUSIONS

We developed a novel de-arraying approach for TMA analysis. By combining wavelet-based detection, active contour segmentation, and thin-plate spline interpolation, our approach is able to handle TMA images with high dynamic, poor signal-to-noise ratio, complex background and non-linear deformation of TMA grid. In addition, the deformation estimation produces quantitative information to asset the manufacturing quality of TMAs.

摘要

背景

在过去的二十年中,一种名为组织微阵列(TMA)的创新技术得到了广泛应用,该技术结合了多组织和 DNA 微阵列的概念。它由一组(多达 1000 个或更多)组织样本组成,根据设计网格(阵列)布局组装到单个载体上-通常是载玻片上,以便在相同和标准化的条件下对多个样本进行多路分析。然而,在 TMA 制造过程中,由于组装组织样本时的不精确性和嵌入蜡的变形,样本位置可能会严重偏离设计网格。因此,当设计与其制造输出之间的样本身份不匹配时,这些扭曲可能会导致(组织学)测定结果的严重误差。因此,开发一种强大的 TMA 去阵列方法,定位和匹配 TMA 样本及其设计网格,对于克服这项突出技术的瓶颈至关重要。

结果

在本文中,我们提出了一种专用于明场和荧光显微镜(或扫描仪)采集图像的自动、快速和鲁棒的 TMA 去阵列(ATMAD)方法。首先,通过在输入 TMA 图像的各向同性小波变换上应用局部自适应阈值处理,在大图中定位组织样本。为了减少误检,在每个检测到的位置考虑使用参数形状模型来分割椭圆形状的对象。在与设计网格匹配之前,从组织样本列表中丢弃不符合大小和圆度标准的分割对象。通过在薄板模型下估计 TMA 网格变形来进行样本匹配。最后,通过运行第二个分割步骤,利用估计的变形识别在早期图像处理步骤中初步拒绝的真实组织样本。

结论

我们开发了一种用于 TMA 分析的新型去阵列方法。通过结合基于小波的检测、主动轮廓分割和薄板样条插值,我们的方法能够处理具有高动态、低信噪比、复杂背景和 TMA 网格非线性变形的 TMA 图像。此外,变形估计产生定量信息来评估 TMAs 的制造质量。

https://cdn.ncbi.nlm.nih.gov/pmc/blobs/6b14/5909283/d7fc2613c205/12859_2018_2111_Fig14_HTML.jpg
https://cdn.ncbi.nlm.nih.gov/pmc/blobs/6b14/5909283/5d995da7afdc/12859_2018_2111_Fig1_HTML.jpg
https://cdn.ncbi.nlm.nih.gov/pmc/blobs/6b14/5909283/ff1f6e79e4c9/12859_2018_2111_Fig2_HTML.jpg
https://cdn.ncbi.nlm.nih.gov/pmc/blobs/6b14/5909283/c3d4c3127aed/12859_2018_2111_Fig3_HTML.jpg
https://cdn.ncbi.nlm.nih.gov/pmc/blobs/6b14/5909283/dfde725ba910/12859_2018_2111_Fig4_HTML.jpg
https://cdn.ncbi.nlm.nih.gov/pmc/blobs/6b14/5909283/485e7d1d38a0/12859_2018_2111_Fig5_HTML.jpg
https://cdn.ncbi.nlm.nih.gov/pmc/blobs/6b14/5909283/675ea1d039ae/12859_2018_2111_Fig6_HTML.jpg
https://cdn.ncbi.nlm.nih.gov/pmc/blobs/6b14/5909283/d4b9d4ce91d8/12859_2018_2111_Fig7_HTML.jpg
https://cdn.ncbi.nlm.nih.gov/pmc/blobs/6b14/5909283/829cb41b40ce/12859_2018_2111_Fig8_HTML.jpg
https://cdn.ncbi.nlm.nih.gov/pmc/blobs/6b14/5909283/3024028228d7/12859_2018_2111_Fig9_HTML.jpg
https://cdn.ncbi.nlm.nih.gov/pmc/blobs/6b14/5909283/734857e0dfdc/12859_2018_2111_Fig10_HTML.jpg
https://cdn.ncbi.nlm.nih.gov/pmc/blobs/6b14/5909283/f7148cb6702d/12859_2018_2111_Fig11_HTML.jpg
https://cdn.ncbi.nlm.nih.gov/pmc/blobs/6b14/5909283/a333ed29f149/12859_2018_2111_Fig12_HTML.jpg
https://cdn.ncbi.nlm.nih.gov/pmc/blobs/6b14/5909283/3bbe522570c6/12859_2018_2111_Fig13_HTML.jpg
https://cdn.ncbi.nlm.nih.gov/pmc/blobs/6b14/5909283/d7fc2613c205/12859_2018_2111_Fig14_HTML.jpg

相似文献

1
ATMAD: robust image analysis for Automatic Tissue MicroArray De-arraying.自动组织微阵列解阵列的强大图像分析(ATMAD)。
BMC Bioinformatics. 2018 Apr 19;19(1):148. doi: 10.1186/s12859-018-2111-8.
2
A TMA de-arraying method for high throughput biomarker discovery in tissue research.一种用于组织研究中高通量生物标志物发现的 TMA 解阵列方法。
PLoS One. 2011;6(10):e26007. doi: 10.1371/journal.pone.0026007. Epub 2011 Oct 7.
3
Robust gridding of TMAs after whole-slide imaging using template matching.使用模板匹配对全切片成像后的 TMA 进行稳健的网格化。
Cytometry A. 2010 Dec;77(12):1169-76. doi: 10.1002/cyto.a.20949.
4
An automated procedure to properly handle digital images in large scale tissue microarray experiments.一种在大规模组织微阵列实验中正确处理数字图像的自动化程序。
Comput Methods Programs Biomed. 2005 Sep;79(3):197-208. doi: 10.1016/j.cmpb.2005.04.004.
5
Methods for automatic microarray image segmentation.自动微阵列图像分割方法。
IEEE Trans Nanobioscience. 2003 Dec;2(4):202-14. doi: 10.1109/tnb.2003.817023.
6
TmaDB: a repository for tissue microarray data.TmaDB:一个组织微阵列数据存储库。
BMC Bioinformatics. 2005 Sep 1;6:218. doi: 10.1186/1471-2105-6-218.
7
Automatic handling of tissue microarray cores in high-dimensional microscopy images.高维显微镜图像中组织微阵列核心的自动处理
IEEE J Biomed Health Inform. 2014 May;18(3):999-1007. doi: 10.1109/JBHI.2013.2282816. Epub 2013 Sep 20.
8
Digital microscopy for boosting database integration and analysis in TMA studies.数字显微镜技术助力组织微阵列(TMA)研究中的数据库整合与分析
Methods Mol Biol. 2010;664:163-75. doi: 10.1007/978-1-60761-806-5_16.
9
Internet-based Profiler system as integrative framework to support translational research.基于互联网的分析系统作为支持转化研究的综合框架。
BMC Bioinformatics. 2005 Dec 19;6:304. doi: 10.1186/1471-2105-6-304.
10
New tissue microarray technology for analyses of gene expression in frozen pathological samples.用于分析冷冻病理样本中基因表达的新型组织微阵列技术。
Biotechniques. 2007 Jul;43(1):101-5. doi: 10.2144/000112498.

引用本文的文献

1
Characterization of Cytotoxic T Lymphocytes (CTL) by Tissue Microarray.组织微阵列分析细胞毒性 T 淋巴细胞(CTL)。
Methods Mol Biol. 2021;2325:107-124. doi: 10.1007/978-1-0716-1507-2_8.
2
Automatic microarray image segmentation with clustering-based algorithms.基于聚类算法的自动微阵列图像分割。
PLoS One. 2019 Jan 22;14(1):e0210075. doi: 10.1371/journal.pone.0210075. eCollection 2019.

本文引用的文献

1
Multiple objects detection in biological images using a marked point process framework.使用标记点过程框架在生物图像中进行多目标检测。
Methods. 2017 Feb 15;115:2-8. doi: 10.1016/j.ymeth.2016.09.009. Epub 2016 Sep 21.
2
SpotCaliper: fast wavelet-based spot detection with accurate size estimation.SpotCaliper:基于快速小波的斑点检测,具有准确的尺寸估计。
Bioinformatics. 2016 Apr 15;32(8):1278-80. doi: 10.1093/bioinformatics/btv728. Epub 2015 Dec 10.
3
Tissue microarray design and construction for scientific, industrial and diagnostic use.
用于科研、工业和诊断用途的组织微阵列设计与构建。
J Pathol Inform. 2012;3:42. doi: 10.4103/2153-3539.104904. Epub 2012 Dec 20.
4
A TMA de-arraying method for high throughput biomarker discovery in tissue research.一种用于组织研究中高通量生物标志物发现的 TMA 解阵列方法。
PLoS One. 2011;6(10):e26007. doi: 10.1371/journal.pone.0026007. Epub 2011 Oct 7.
5
Robust gridding of TMAs after whole-slide imaging using template matching.使用模板匹配对全切片成像后的 TMA 进行稳健的网格化。
Cytometry A. 2010 Dec;77(12):1169-76. doi: 10.1002/cyto.a.20949.
6
The ovuscule.卵小球。
IEEE Trans Pattern Anal Mach Intell. 2011 Feb;33(2):382-93. doi: 10.1109/TPAMI.2010.112.
7
Snakuscules.蛇形生物。 (注:原文“Snakuscules”可能是生造词,根据词形推测大致意思是类似蛇的生物,这里按此推测进行翻译)
IEEE Trans Image Process. 2008 Apr;17(4):585-93. doi: 10.1109/TIP.2007.914742.
8
Active contours without edges.无边缘活动轮廓。
IEEE Trans Image Process. 2001;10(2):266-77. doi: 10.1109/83.902291.
9
Framework for parsing, visualizing and scoring tissue microarray images.用于解析、可视化和评分组织微阵列图像的框架。
IEEE Trans Inf Technol Biomed. 2006 Apr;10(2):209-19. doi: 10.1109/titb.2005.855544.
10
Automatic tracking of individual fluorescence particles: application to the study of chromosome dynamics.单个荧光颗粒的自动跟踪:在染色体动力学研究中的应用
IEEE Trans Image Process. 2005 Sep;14(9):1372-83. doi: 10.1109/tip.2005.852787.