• 文献检索
  • 文档翻译
  • 深度研究
  • 学术资讯
  • Suppr Zotero 插件Zotero 插件
  • 邀请有礼
  • 套餐&价格
  • 历史记录
应用&插件
Suppr Zotero 插件Zotero 插件浏览器插件Mac 客户端Windows 客户端微信小程序
定价
高级版会员购买积分包购买API积分包
服务
文献检索文档翻译深度研究API 文档MCP 服务
关于我们
关于 Suppr公司介绍联系我们用户协议隐私条款
关注我们

Suppr 超能文献

核心技术专利:CN118964589B侵权必究
粤ICP备2023148730 号-1Suppr @ 2026

文献检索

告别复杂PubMed语法,用中文像聊天一样搜索,搜遍4000万医学文献。AI智能推荐,让科研检索更轻松。

立即免费搜索

文件翻译

保留排版,准确专业,支持PDF/Word/PPT等文件格式,支持 12+语言互译。

免费翻译文档

深度研究

AI帮你快速写综述,25分钟生成高质量综述,智能提取关键信息,辅助科研写作。

立即免费体验

利用简单产量估算算法(SAFY)农艺气象模型结合光学 SPOT/HRV 图像对半干旱地区的谷物产量进行预测。

Forecasting of Cereal Yields in a Semi-arid Area Using the Simple Algorithm for Yield Estimation (SAFY) Agro-Meteorological Model Combined with Optical SPOT/HRV Images.

机构信息

LR17AGR01 (LR GREEN-TEAM)/INAT, University Carthage, Avenue de la République, P.O. Box 77, Carthage, Tunis 1054, Tunisia.

ISET_Nabeul, Campus Universitaire Mrezgua, Nabeul 8000, Tunisie.

出版信息

Sensors (Basel). 2018 Jul 3;18(7):2138. doi: 10.3390/s18072138.

DOI:10.3390/s18072138
PMID:29970840
原文链接:https://pmc.ncbi.nlm.nih.gov/articles/PMC6068716/
Abstract

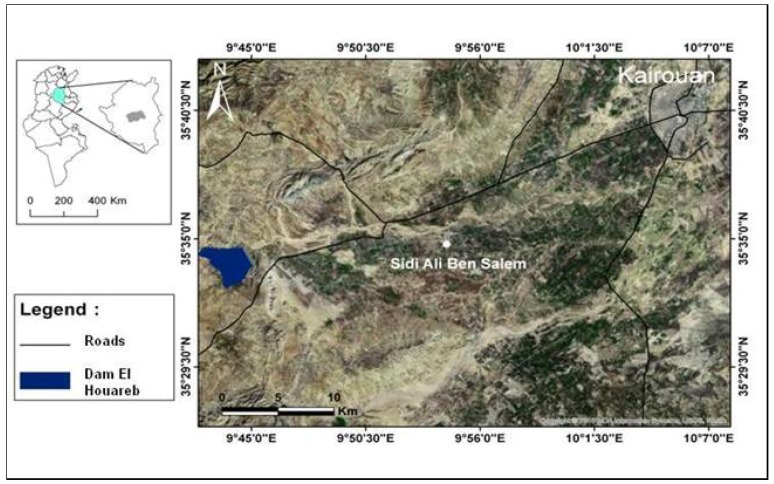
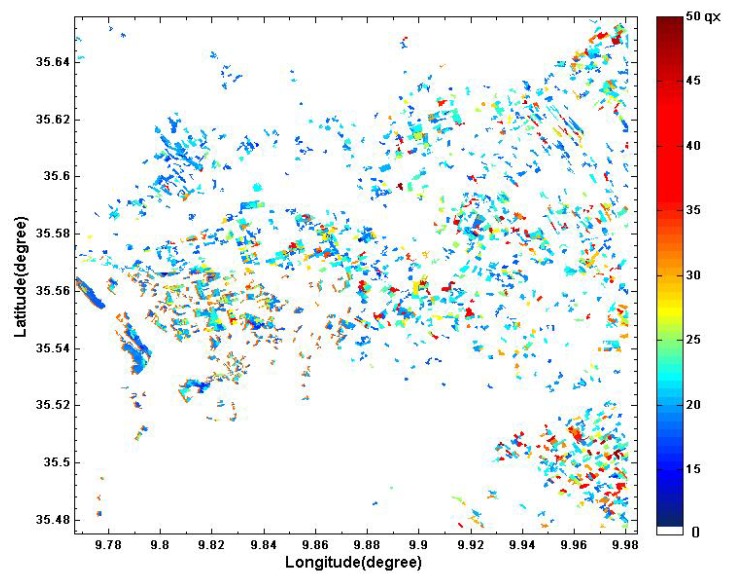
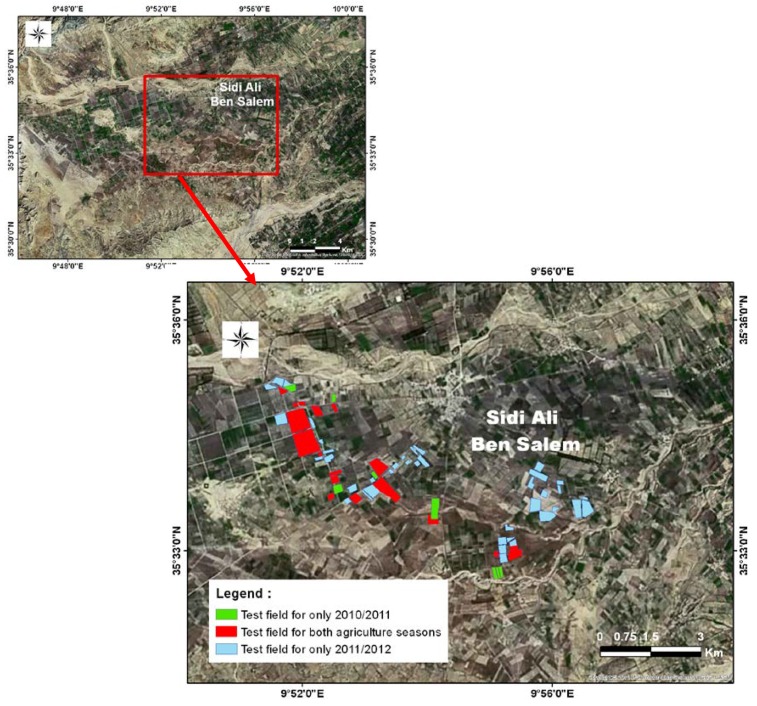
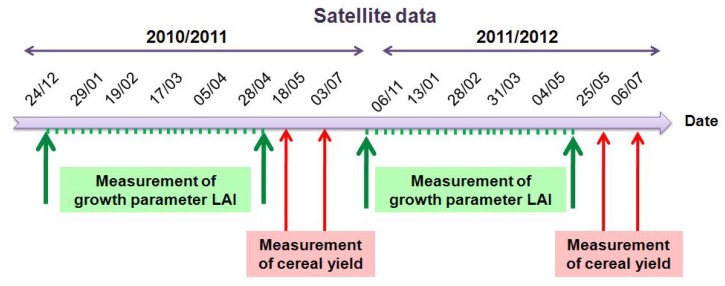
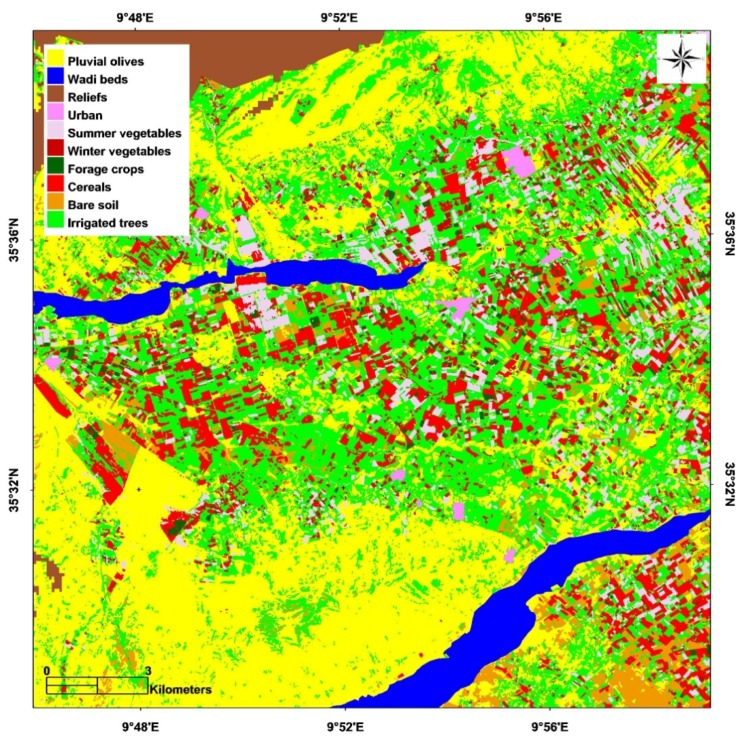
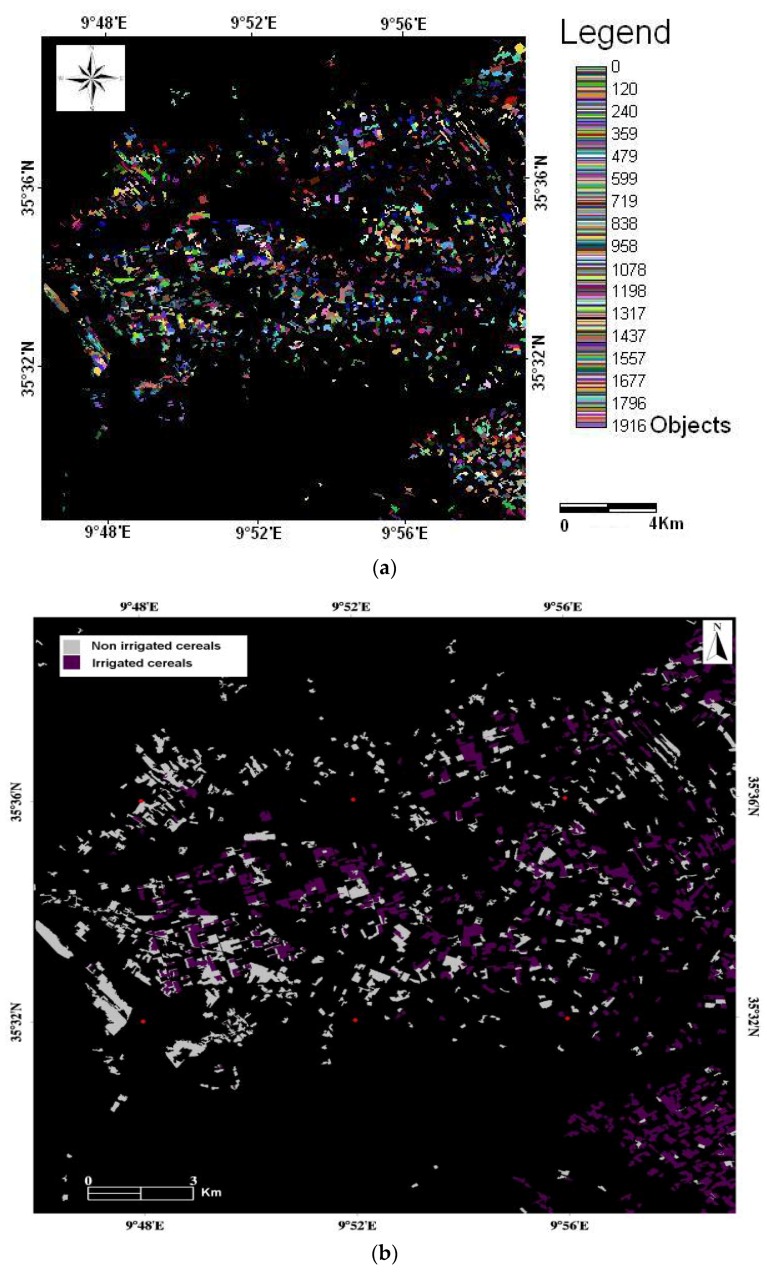
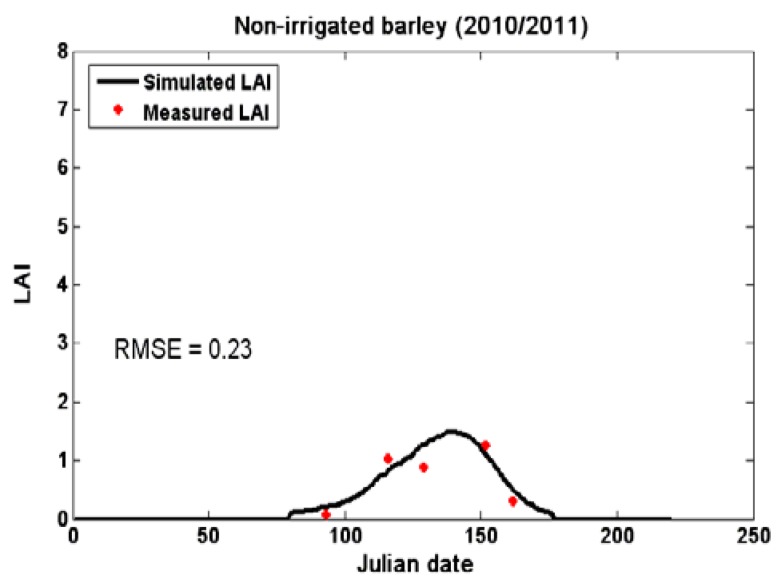
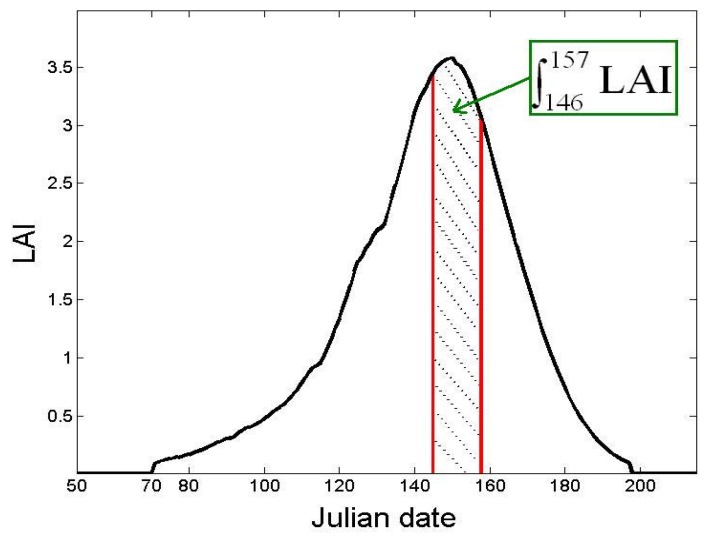
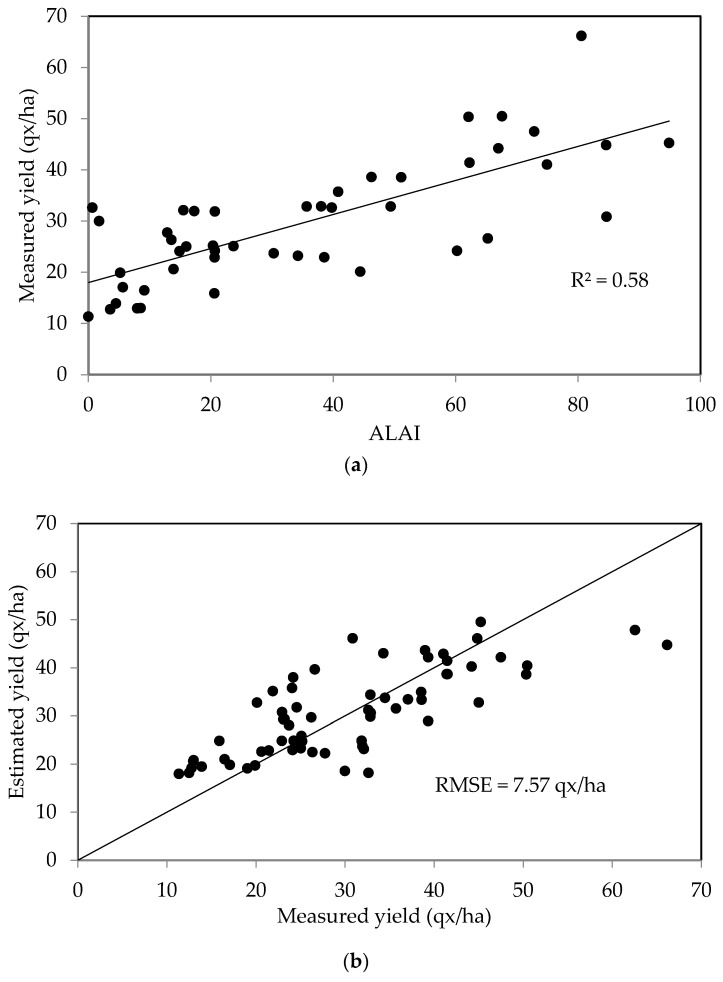
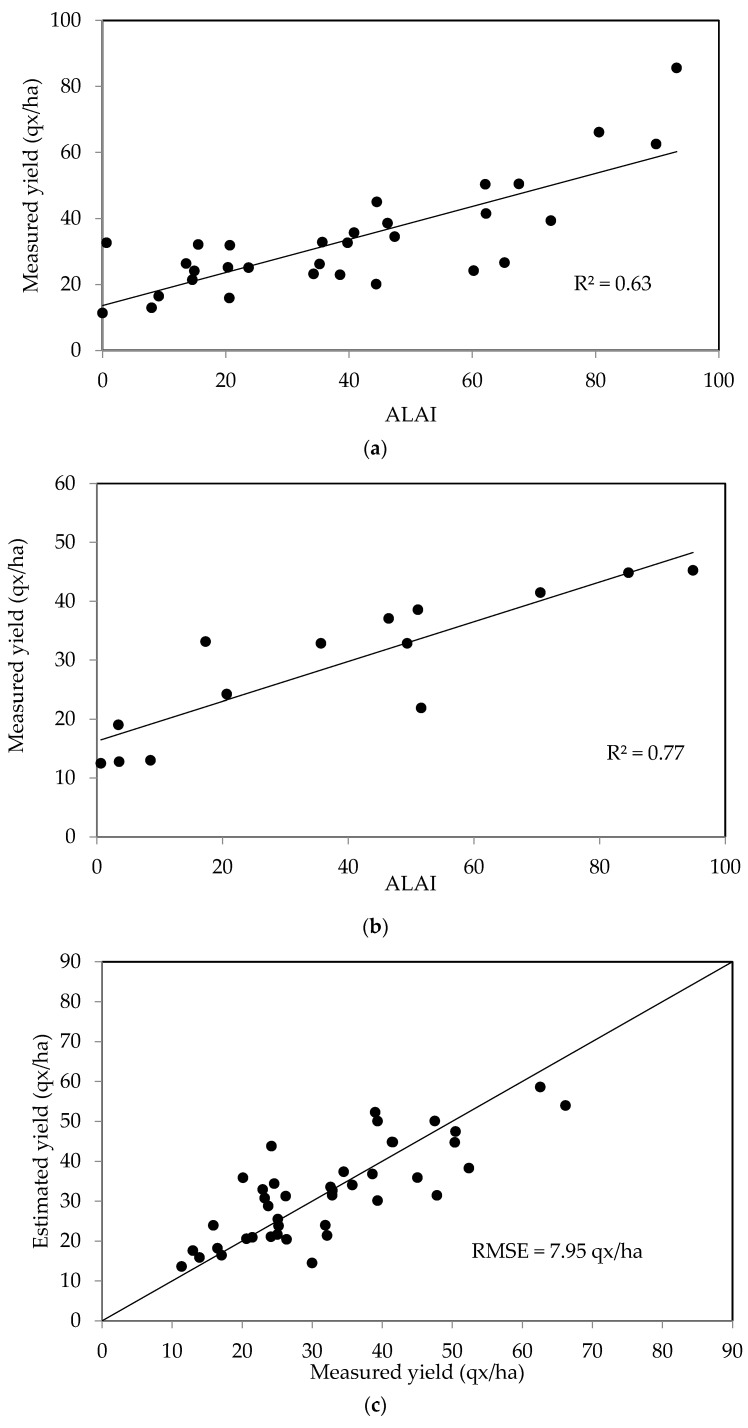
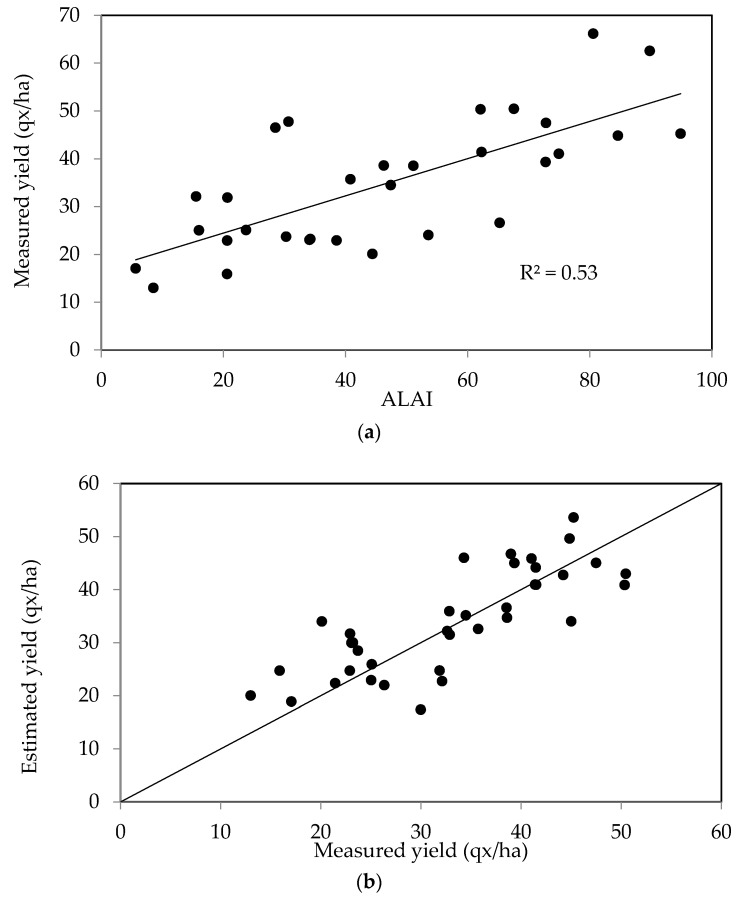
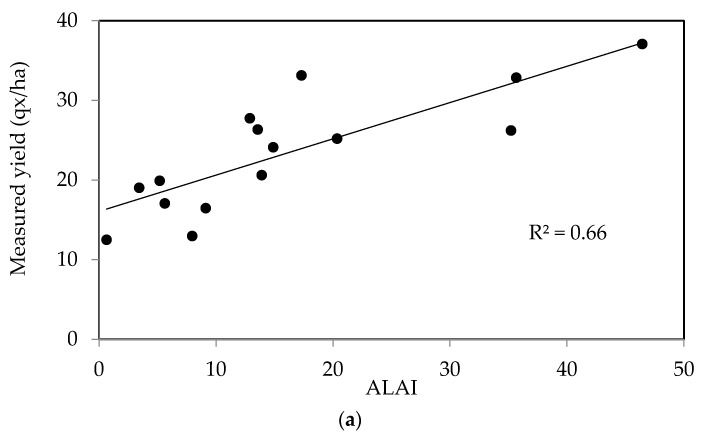
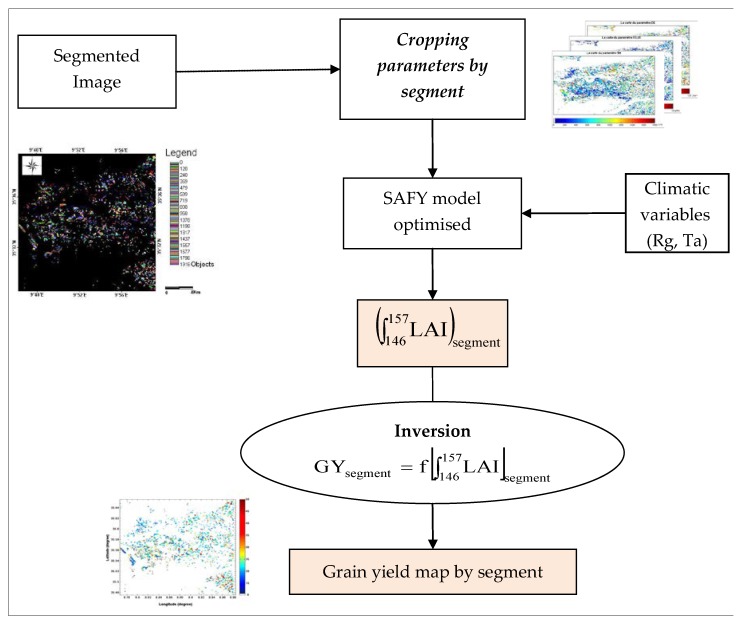
In semi-arid areas characterized by frequent drought events, there is often a strong need for an operational grain yield forecasting system, to help decision-makers with the planning of annual imports. However, monitoring the crop canopy and production capacity of plants, especially for cereals, can be challenging. In this paper, a new approach to yield estimation by combining data from the Simple Algorithm for Yield estimation (SAFY) agro-meteorological model with optical SPOT/ High Visible Resolution (HRV) satellite data is proposed. Grain yields are then statistically estimated as a function of Leaf Area Index (LAI) during the maximum growth period between 25 March and 5 April. The LAI is retrieved from the SAFY model, and calibrated using SPOT/HRV data. This study is based on the analysis of a rich database, which was acquired over a period of two years (2010⁻2011, 2012⁻2013) at the Merguellil site in central Tunisia (North Africa) from more than 60 test fields and 20 optical satellite SPOT/HRV images. The validation and calibration of this methodology is presented, on the basis of two subsets of observations derived from the experimental database. Finally, an inversion technique is applied to estimate the overall yield of the entire studied site.

摘要

在以频繁干旱事件为特征的半干旱地区,通常强烈需要一个运行的谷物产量预测系统,以帮助决策者规划年度进口。然而,监测作物冠层和植物的生产能力,特别是对谷物而言,可能具有挑战性。在本文中,提出了一种将 Simple Algorithm for Yield estimation(SAFY)农业气象模型的数据与光学 SPOT/High Visible Resolution(HRV)卫星数据相结合来进行产量估计的新方法。然后根据 3 月 25 日至 4 月 5 日最大生长期内的叶面积指数(LAI)统计估算谷物产量。LAI 从 SAFY 模型中获取,并使用 SPOT/HRV 数据进行校准。本研究基于对一个丰富数据库的分析,该数据库是在突尼斯中部 Merguellil 站点(北非)在两年(2010-2011、2012-2013 年)期间从 60 多个测试场和 20 个光学卫星 SPOT/HRV 图像中获取的。基于从实验数据库中得出的两个观测子集,提出了对该方法的验证和校准。最后,应用反演技术来估计整个研究点的总产量。

https://cdn.ncbi.nlm.nih.gov/pmc/blobs/788c/6068716/a84a8ef03efd/sensors-18-02138-g013.jpg
https://cdn.ncbi.nlm.nih.gov/pmc/blobs/788c/6068716/a3465f8f7248/sensors-18-02138-g001.jpg
https://cdn.ncbi.nlm.nih.gov/pmc/blobs/788c/6068716/5e7d10ebde0a/sensors-18-02138-g002.jpg
https://cdn.ncbi.nlm.nih.gov/pmc/blobs/788c/6068716/b389edcaf832/sensors-18-02138-g003.jpg
https://cdn.ncbi.nlm.nih.gov/pmc/blobs/788c/6068716/54716c8b1b4c/sensors-18-02138-g004.jpg
https://cdn.ncbi.nlm.nih.gov/pmc/blobs/788c/6068716/ead6c8143ad3/sensors-18-02138-g005.jpg
https://cdn.ncbi.nlm.nih.gov/pmc/blobs/788c/6068716/716805123d0b/sensors-18-02138-g006a.jpg
https://cdn.ncbi.nlm.nih.gov/pmc/blobs/788c/6068716/31c27b19bffb/sensors-18-02138-g007.jpg
https://cdn.ncbi.nlm.nih.gov/pmc/blobs/788c/6068716/417d854ed479/sensors-18-02138-g008.jpg
https://cdn.ncbi.nlm.nih.gov/pmc/blobs/788c/6068716/126fd193d66f/sensors-18-02138-g009a.jpg
https://cdn.ncbi.nlm.nih.gov/pmc/blobs/788c/6068716/97aedb757c67/sensors-18-02138-g010.jpg
https://cdn.ncbi.nlm.nih.gov/pmc/blobs/788c/6068716/3031666bc655/sensors-18-02138-g011a.jpg
https://cdn.ncbi.nlm.nih.gov/pmc/blobs/788c/6068716/e19fceffec34/sensors-18-02138-g012.jpg
https://cdn.ncbi.nlm.nih.gov/pmc/blobs/788c/6068716/a84a8ef03efd/sensors-18-02138-g013.jpg

相似文献

1
Forecasting of Cereal Yields in a Semi-arid Area Using the Simple Algorithm for Yield Estimation (SAFY) Agro-Meteorological Model Combined with Optical SPOT/HRV Images.利用简单产量估算算法(SAFY)农艺气象模型结合光学 SPOT/HRV 图像对半干旱地区的谷物产量进行预测。
Sensors (Basel). 2018 Jul 3;18(7):2138. doi: 10.3390/s18072138.
2
Using spatio-temporal fusion of Landsat-8 and MODIS data to derive phenology, biomass and yield estimates for corn and soybean.利用 Landsat-8 和 MODIS 数据的时空融合来推导出玉米和大豆的物候、生物量和产量估算。
Sci Total Environ. 2019 Feb 10;650(Pt 2):1707-1721. doi: 10.1016/j.scitotenv.2018.09.308. Epub 2018 Sep 26.
3
Wheat growth monitoring and yield estimation based on remote sensing data assimilation into the SAFY crop growth model.基于遥感数据同化到 SAFY 作物生长模型的小麦生长监测和产量估算。
Sci Rep. 2022 Mar 31;12(1):5473. doi: 10.1038/s41598-022-09535-9.
4
Joint Assimilation of Leaf Area Index and Soil Moisture from Sentinel-1 and Sentinel-2 Data into the WOFOST Model for Winter Wheat Yield Estimation.将哨兵-1和哨兵-2数据中的叶面积指数和土壤湿度联合同化到WOFOST模型中用于冬小麦产量估算
Sensors (Basel). 2019 Jul 18;19(14):3161. doi: 10.3390/s19143161.
5
[Estimation of leaf area index by normalized composite vegetation index fusing the spectral feature of canopy water content].基于冠层含水量光谱特征融合的归一化复合植被指数估算叶面积指数
Guang Pu Xue Yu Guang Pu Fen Xi. 2011 Feb;31(2):478-82.
6
[LAI-based regional winter wheat yield estimation by remote sensing].基于LAI的区域冬小麦遥感产量估算
Ying Yong Sheng Tai Xue Bao. 2010 Nov;21(11):2883-8.
7
Forecasting wheat and barley crop production in arid and semi-arid regions using remotely sensed primary productivity and crop phenology: A case study in Iraq.利用遥感初级生产力和作物物候学预测干旱和半干旱地区的小麦和大麦作物产量:以伊拉克为例。
Sci Total Environ. 2018 Feb 1;613-614:250-262. doi: 10.1016/j.scitotenv.2017.09.057. Epub 2017 Sep 12.
8
Application of remote sensors in mapping rice area and forecasting its production: a review.遥感技术在水稻种植面积测绘与产量预测中的应用综述
Sensors (Basel). 2015 Jan 5;15(1):769-91. doi: 10.3390/s150100769.
9
[Estimating leaf area index by fusing MODIS and MISR data].通过融合中分辨率成像光谱仪(MODIS)和多角度成像光谱辐射计(MISR)数据估算叶面积指数
Guang Pu Xue Yu Guang Pu Fen Xi. 2009 Nov;29(11):3106-11.
10
LAI inversion algorithm based on directional reflectance kernels.基于方向反射核的LAI反演算法
J Environ Manage. 2007 Nov;85(3):638-48. doi: 10.1016/j.jenvman.2006.08.018. Epub 2006 Nov 28.

引用本文的文献

1
Hyperspectral imaging and its applications: A review.高光谱成像及其应用:综述
Heliyon. 2024 Jun 18;10(12):e33208. doi: 10.1016/j.heliyon.2024.e33208. eCollection 2024 Jun 30.
2
Prediction of Crop Yield Using Phenological Information Extracted from Remote Sensing Vegetation Index.利用遥感植被指数提取的物候信息预测作物产量。
Sensors (Basel). 2021 Feb 17;21(4):1406. doi: 10.3390/s21041406.
3
Assessment of the vegetation indices on Sentinel-2A images for predicting the soil productivity potential in Bursa, Turkey.

本文引用的文献

1
Potential of Sentinel-1 Radar Data for the Assessment of Soil and Cereal Cover Parameters.哨兵-1雷达数据用于评估土壤和谷物覆盖参数的潜力
Sensors (Basel). 2017 Nov 14;17(11):2617. doi: 10.3390/s17112617.
2
Validation of a vector version of the 6S radiative transfer code for atmospheric correction of satellite data. Part I: path radiance.用于卫星数据大气校正的 6S 辐射传输代码矢量版本的验证。第一部分:路径辐射率。
Appl Opt. 2006 Sep 10;45(26):6762-74. doi: 10.1364/ao.45.006762.
评估 Sentinel-2A 图像上的植被指数,以预测土耳其布尔萨的土壤生产力潜力。
Environ Monit Assess. 2019 Dec 8;192(1):16. doi: 10.1007/s10661-019-7989-8.