Zheng Weipeng, Huang Yuanping, Chen Haoyi, Wang Ning, Xiao Wende, Liang YingJie, Jiang Xin, Su Wenzhou, Wen Shifeng
Department of Orthopedics, Guangzhou First People's Hospital, Guangzhou Medical University, Guangzhou, Guangdong 510180, People's Republic of China.
Department of Orthopedics, Guangzhou Chest Hospital, Guangzhou, Guangdong 510180, People's Republic of China.
Cancer Manag Res. 2018 Nov 8;10:5439-5450. doi: 10.2147/CMAR.S177945. eCollection 2018.
A prognostic nomogram was applied to predict survival in osteosarcoma patients.
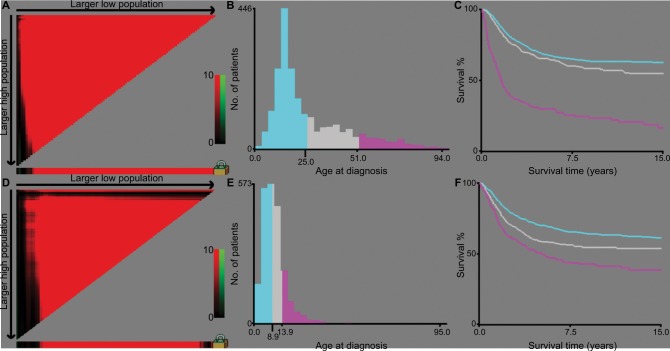
Data collected from 2,195 osteosarcoma patients in the Surveillance, Epidemiology, and End Results (SEER) database between 1983 and 2014 were analyzed. Independent prognostic factors were identified via univariate and multivariate Cox analyses. These were incorporated into a nomogram to predict 3- and 5-year overall survival (OS) and cancer-specific survival (CSS) rates. Internal and external data were used for validation. Concordance indices (C-indices) were used to estimate nomogram accuracy.
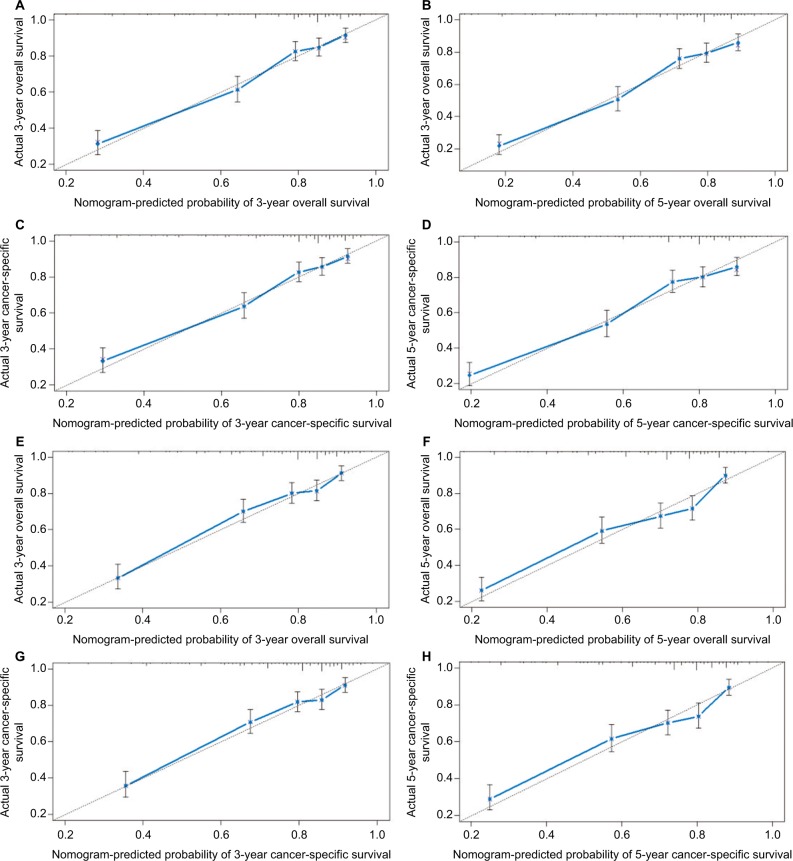
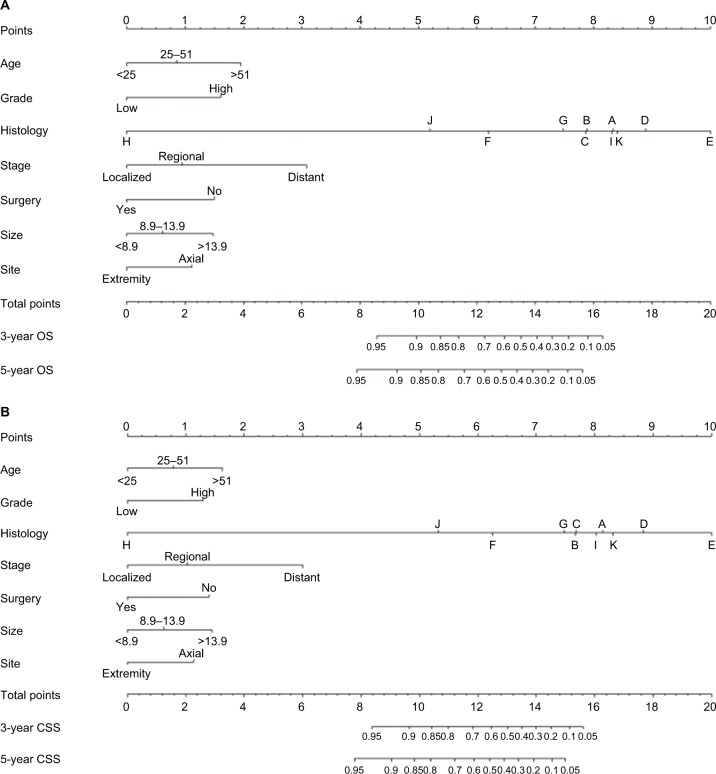
Patients were randomly assigned into a training cohort (n=1,098) or validation cohort (n=1,097). Age at diagnosis, tumor site, histology, tumor size, tumor stage, use of surgery, and tumor grade were identified as independent prognostic factors via univariate and multivariate Cox analyses (all <0.05) and then included in the prognostic nomogram. C-indices for OS and CSS prediction in the training cohort were 0.763 (95% CI 0.761-0.764) and 0.764 (95% CI 0.762-0.765), respectively. C-indices for OS and CSS prediction in the external validation cohort were 0.739 (95% CI 0.737-0.740) and 0.740 (95% CI, 0.738-0.741), respectively. Calibration plots revealed excellent consistency between actual survival and nomogram prediction.
Nomograms were constructed to predict OS and CSS for osteosarcoma patients in the SEER database. They provide accurate and individualized survival prediction.
应用预后列线图预测骨肉瘤患者的生存率。
分析1983年至2014年间从监测、流行病学和最终结果(SEER)数据库中收集的2195例骨肉瘤患者的数据。通过单因素和多因素Cox分析确定独立预后因素。将这些因素纳入列线图以预测3年和5年总生存率(OS)和癌症特异性生存率(CSS)。使用内部和外部数据进行验证。一致性指数(C指数)用于评估列线图的准确性。
患者被随机分为训练队列(n = 1098)或验证队列(n = 1097)。通过单因素和多因素Cox分析(均P<0.05)确定诊断时年龄、肿瘤部位、组织学、肿瘤大小、肿瘤分期、手术使用情况和肿瘤分级为独立预后因素,然后将其纳入预后列线图。训练队列中OS和CSS预测的C指数分别为0.763(95%CI 0.761 - 0.764)和0.764(95%CI 0.762 - 0.765)。外部验证队列中OS和CSS预测的C指数分别为0.739(95%CI 0.737 - 0.740)和0.740(95%CI 0.738 - 0.741)。校准图显示实际生存率与列线图预测之间具有良好的一致性。
构建了列线图以预测SEER数据库中骨肉瘤患者的OS和CSS。它们提供了准确且个体化的生存预测。