Health Policy Institute, American Dental Association, Chicago, Illinois.
JAMA Netw Open. 2018 Jun 1;1(2):e180431. doi: 10.1001/jamanetworkopen.2018.0431.
Over the last 15 years, the health care practitioner landscape has changed significantly. Fewer practitioners are self-employed and more are employed by for-profit or nonprofit organizations. These shifts can have an impact on annual labor earnings.
To examine trends in self-employment and employment and to assess the gap in annual labor earnings between self-employed and employed US health care professionals from 2001 to 2015.
DESIGN, SETTING, AND PARTICIPANTS: Survey study in which data on employment type (self-employed, employed by private sector, or employed by government) and annual labor earnings for 50 states and the District of Columbia were extracted from the 2001 to 2015 American Community Survey. The analyses were restricted to 175 714 self-identified dentists, physicians, pharmacists, optometrists, podiatrists, chiropractors, and physical therapists aged 30 years and older who worked at least 40 weeks per year and 20 hours per week. Controlling for age, sex, race/ethnicity, year, and state of residence, median regression models were used to measure the gap in annual labor earnings between self-employed and employed health care professionals.
Annual labor earnings, defined as the sum of self-employment and wages or salary income.
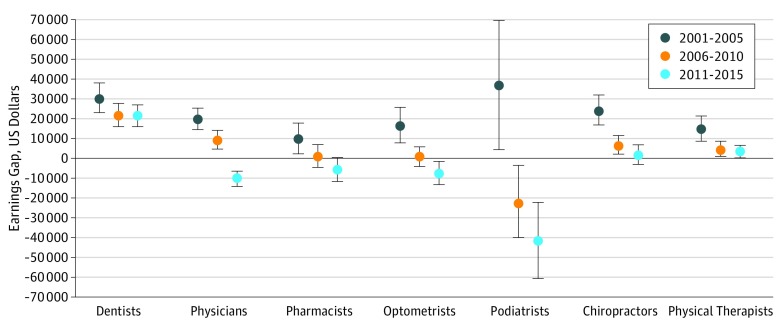
Our sample of 175 714 respondents included 99 077 physicians, 20 008 dentists, 26 143 pharmacists, 4238 optometrists, 6076 chiropractors, 1164 podiatrists, and 19 008 physical therapists. The weighted percentage of self-employed physicians decreased from 35.2% (95% CI, 34.4%-36.1%; 6807 of 18 726 physicians) in 2001 through 2005 to 24.7% (95% CI, 24.2%-25.2%; 10 974 of 41 205 physicians) in 2011 through 2015. The percentage of self-employed dentists decreased from 73.0% (95% CI, 71.2%-74.8%; 3117 of 4153 dentists) in 2001 through 2005 to 65.1% (95% CI, 63.7%-66.4%; 5260 of 7820 dentists) in 2011 through 2015. Among physicians, the regression-adjusted earnings gap reversed from $19 679 (95% CI, $14 431-$24 927; P < .001) during 2001 through 2005 to -$10 623 (95% CI, -$14 547 to -$6699; P < .001) during 2011 through 2015. Among dentists, the regression-adjusted earnings gap narrowed from $30 448 (95% CI, $23 040-$37 855; P < .001) during 2001 through 2005 to $21 291 (95% CI, $15 723-$26 859; P < .001) during 2011 through 2015. From 2001 to 2015 the earnings gap also reversed among pharmacists, optometrists, and podiatrists. The regression-adjusted earnings gap narrowed among chiropractors and physical therapists.
Since 2001, the percentage of health care professionals who are self-employed declined, and the gap in earnings between self-employed and employed health care professionals narrowed.
在过去的 15 年中,医疗保健从业者的格局发生了重大变化。自我雇佣的从业者越来越少,更多的从业者受雇于营利性或非营利性组织。这些转变可能会对年度劳动收入产生影响。
研究自我雇佣和就业的趋势,并评估 2001 年至 2015 年期间,美国自雇和受雇医疗保健专业人员之间的年度劳动收入差距。
设计、地点和参与者:调查研究,从 2001 年至 2015 年的美国社区调查中提取了 50 个州和哥伦比亚特区的就业类型(自我雇佣、私营部门雇佣或政府雇佣)和年收入数据。分析仅限于年龄在 30 岁及以上、每年至少工作 40 周、每周至少工作 20 小时的 175714 名自我认定的牙医、医生、药剂师、验光师、足病医生、脊椎按摩师和物理治疗师。使用中位数回归模型,在控制年龄、性别、种族/民族、年份和居住州的情况下,衡量自雇和受雇医疗保健专业人员之间的年度劳动收入差距。
年收入,定义为自我雇佣和工资或薪水收入的总和。
我们的 175714 名受访者样本包括 99077 名医生、20008 名牙医、26143 名药剂师、4238 名验光师、6076 名脊椎按摩师、1164 名足病医生和 19008 名物理治疗师。自雇医生的百分比从 2001 年至 2005 年的 35.2%(95%CI,34.4%-36.1%;18726 名医生中的 6807 名)下降到 2011 年至 2015 年的 24.7%(95%CI,24.2%-25.2%;41205 名医生中的 10974 名)。自雇牙医的百分比从 2001 年至 2005 年的 73.0%(95%CI,71.2%-74.8%;4153 名牙医中的 3117 名)下降到 2011 年至 2015 年的 65.1%(95%CI,63.7%-66.4%;7820 名牙医中的 5260 名)。在医生中,调整后的收入差距从 2001 年至 2005 年的 19679 美元(95%CI,14431 美元至 24927 美元;P<0.001)转为 2011 年至 2015 年的-10623 美元(95%CI,-14547 美元至-6699 美元;P<0.001)。在牙医中,调整后的收入差距从 2001 年至 2005 年的 30448 美元(95%CI,23040 美元至 37855 美元;P<0.001)缩小到 2011 年至 2015 年的 21291 美元(95%CI,15723 美元至 26859 美元;P<0.001)。自 2001 年以来,药剂师、验光师和足病医生的收入差距也出现了逆转。脊椎按摩师和物理治疗师的调整后收入差距缩小。
自 2001 年以来,自我雇佣的医疗保健专业人员比例下降,自雇和受雇医疗保健专业人员之间的收入差距缩小。