• 文献检索
  • 文档翻译
  • 深度研究
  • 学术资讯
  • Suppr Zotero 插件Zotero 插件
  • 邀请有礼
  • 套餐&价格
  • 历史记录
应用&插件
Suppr Zotero 插件Zotero 插件浏览器插件Mac 客户端Windows 客户端微信小程序
定价
高级版会员购买积分包购买API积分包
服务
文献检索文档翻译深度研究API 文档MCP 服务
关于我们
关于 Suppr公司介绍联系我们用户协议隐私条款
关注我们

Suppr 超能文献

核心技术专利:CN118964589B侵权必究
粤ICP备2023148730 号-1Suppr @ 2026

文献检索

告别复杂PubMed语法,用中文像聊天一样搜索,搜遍4000万医学文献。AI智能推荐,让科研检索更轻松。

立即免费搜索

文件翻译

保留排版,准确专业,支持PDF/Word/PPT等文件格式,支持 12+语言互译。

免费翻译文档

深度研究

AI帮你快速写综述,25分钟生成高质量综述,智能提取关键信息,辅助科研写作。

立即免费体验

利用深度学习研究建筑环境与社区成年人肥胖患病率之间的关系。

Use of Deep Learning to Examine the Association of the Built Environment With Prevalence of Neighborhood Adult Obesity.

机构信息

Department of Biomedical Informatics and Medical Education, University of Washington, Seattle.

Institute for Health Metrics and Evaluation, University of Washington, Seattle.

出版信息

JAMA Netw Open. 2018 Aug 3;1(4):e181535. doi: 10.1001/jamanetworkopen.2018.1535.

DOI:10.1001/jamanetworkopen.2018.1535
PMID:30646134
原文链接:https://pmc.ncbi.nlm.nih.gov/articles/PMC6324519/
Abstract

IMPORTANCE

More than one-third of the adult population in the United States is obese. Obesity has been linked to factors such as genetics, diet, physical activity, and the environment. However, evidence indicating associations between the built environment and obesity has varied across studies and geographical contexts.

OBJECTIVE

To propose an approach for consistent measurement of the features of the built environment (ie, both natural and modified elements of the physical environment) and its association with obesity prevalence to allow for comparison across studies.

DESIGN

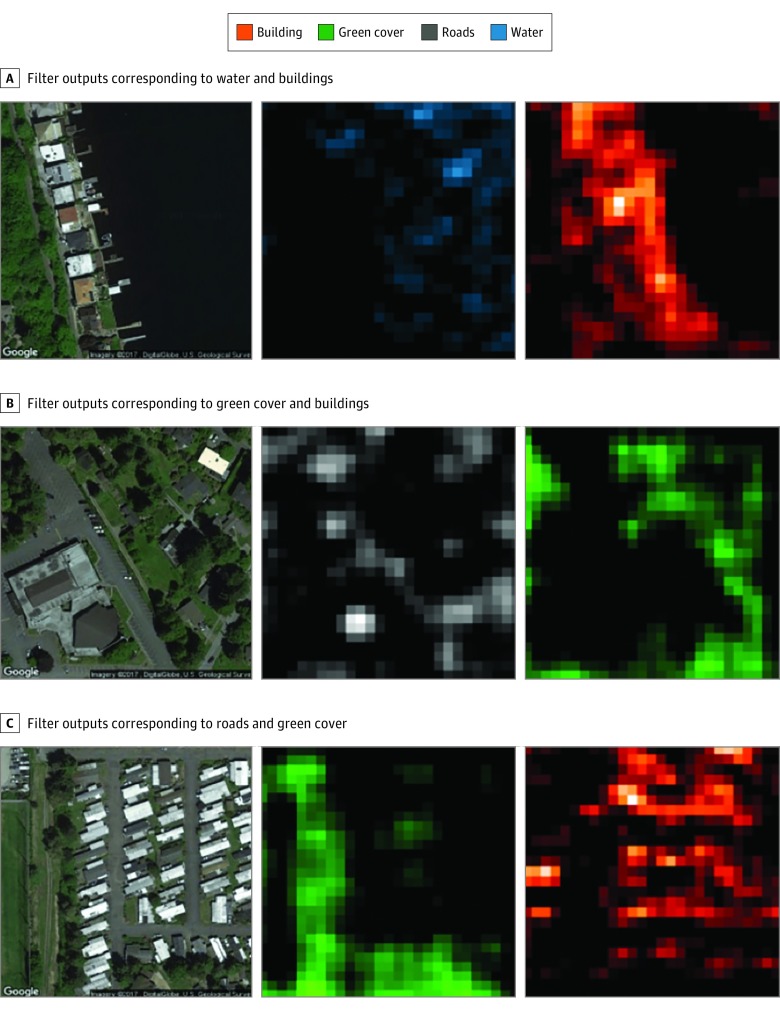
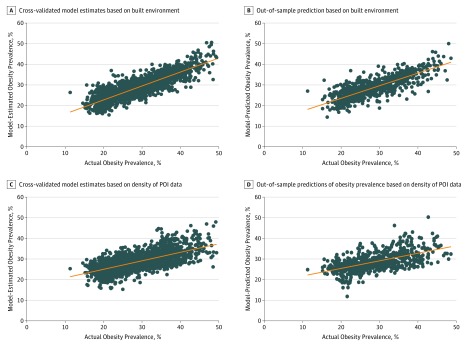
The cross-sectional study was conducted from February 14 through October 31, 2017. A convolutional neural network, a deep learning approach, was applied to approximately 150 000 high-resolution satellite images from Google Static Maps API (application programing interface) to extract features of the built environment in Los Angeles, California; Memphis, Tennessee; San Antonio, Texas; and Seattle (representing Seattle, Tacoma, and Bellevue), Washington. Data on adult obesity prevalence were obtained from the Centers for Disease Control and Prevention's 500 Cities project. Regression models were used to quantify the association between the features and obesity prevalence across census tracts.

MAIN OUTCOMES AND MEASURES

Model-estimated obesity prevalence (obesity defined as body mass index ≥30, calculated as weight in kilograms divided by height in meters squared) based on built environment information.

RESULTS

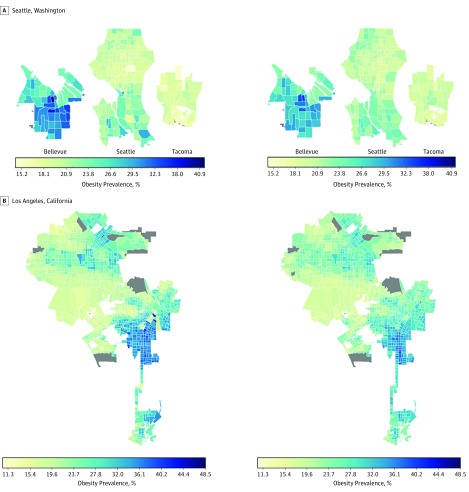
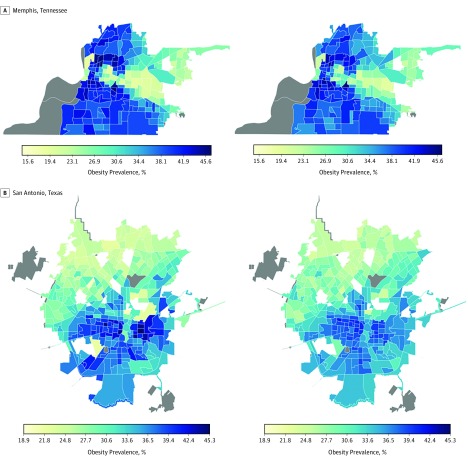
The study included 1695 census tracts in 6 cities. The age-adjusted obesity prevalence was 18.8% (95% CI, 18.6%-18.9%) for Bellevue, 22.4% (95% CI, 22.3%-22.5%) for Seattle, 30.8% (95% CI, 30.6%-31.0%) for Tacoma, 26.7% (95% CI, 26.7%-26.8%) for Los Angeles, 36.3% (95% CI, 36.2%-36.5%) for Memphis, and 32.9% (95% CI, 32.8%-32.9%) for San Antonio. Features of the built environment explained 64.8% (root mean square error [RMSE], 4.3) of the variation in obesity prevalence across all census tracts. Individually, the variation explained was 55.8% (RMSE, 3.2) for Seattle (213 census tracts), 56.1% (RMSE, 4.2) for Los Angeles (993 census tracts), 73.3% (RMSE, 4.5) for Memphis (178 census tracts), and 61.5% (RMSE, 3.5) for San Antonio (311 census tracts).

CONCLUSIONS AND RELEVANCE

This study illustrates that convolutional neural networks can be used to automate the extraction of features of the built environment from satellite images for studying health indicators. Understanding the association between specific features of the built environment and obesity prevalence can lead to structural changes that could encourage physical activity and decreases in obesity prevalence.

摘要

重要性

美国超过三分之一的成年人口肥胖。肥胖与遗传、饮食、体育活动和环境等因素有关。然而,不同研究和地理背景下的证据表明,建筑环境与肥胖之间存在关联。

目的

提出一种一致测量建筑环境特征(即物理环境的自然和人为元素)及其与肥胖流行率之间关联的方法,以便在研究之间进行比较。

设计

这项横断面研究于 2017 年 2 月 14 日至 10 月 31 日进行。应用卷积神经网络(一种深度学习方法)从 Google Static Maps API(应用程序编程接口)中约 150000 张高分辨率卫星图像中提取加利福尼亚州洛杉矶、田纳西州孟菲斯、得克萨斯州圣安东尼奥和华盛顿州西雅图(代表西雅图、塔科马和贝尔维尤)的建筑环境特征。成人肥胖流行率的数据来自疾病控制与预防中心的 500 个城市项目。回归模型用于量化整个普查区建筑环境特征与肥胖流行率之间的关联。

主要结果和措施

基于建筑环境信息的模型估计肥胖流行率(肥胖定义为体重指数≥30,计算为体重(千克)除以身高(米)的平方)。

结果

该研究包括 6 个城市的 1695 个普查区。调整年龄后的肥胖流行率为:贝尔维尤 18.8%(95%CI,18.6%-18.9%),西雅图 22.4%(95%CI,22.3%-22.5%),塔科马 30.8%(95%CI,30.6%-31.0%),洛杉矶 26.7%(95%CI,26.7%-26.8%),孟菲斯 36.3%(95%CI,36.2%-36.5%),圣安东尼奥 32.9%(95%CI,32.8%-32.9%)。建筑环境特征解释了所有普查区肥胖流行率变化的 64.8%(均方根误差[RMSE],4.3)。单独来看,西雅图(213 个普查区)的解释变异为 55.8%(RMSE,3.2),洛杉矶(993 个普查区)为 56.1%(RMSE,4.2),孟菲斯(178 个普查区)为 73.3%(RMSE,4.5),圣安东尼奥(311 个普查区)为 61.5%(RMSE,3.5)。

结论和相关性

本研究表明,卷积神经网络可用于从卫星图像中自动提取建筑环境特征,以研究健康指标。了解建筑环境特定特征与肥胖流行率之间的关联,可以促使进行结构变化,从而鼓励体育活动并降低肥胖流行率。

https://cdn.ncbi.nlm.nih.gov/pmc/blobs/5886/6324519/1b1902952c2a/jamanetwopen-1-e181535-g004.jpg
https://cdn.ncbi.nlm.nih.gov/pmc/blobs/5886/6324519/7f0f6be8952e/jamanetwopen-1-e181535-g001.jpg
https://cdn.ncbi.nlm.nih.gov/pmc/blobs/5886/6324519/c83f40be4f77/jamanetwopen-1-e181535-g002.jpg
https://cdn.ncbi.nlm.nih.gov/pmc/blobs/5886/6324519/e54f08cfa09b/jamanetwopen-1-e181535-g003.jpg
https://cdn.ncbi.nlm.nih.gov/pmc/blobs/5886/6324519/1b1902952c2a/jamanetwopen-1-e181535-g004.jpg

相似文献

1
Use of Deep Learning to Examine the Association of the Built Environment With Prevalence of Neighborhood Adult Obesity.利用深度学习研究建筑环境与社区成年人肥胖患病率之间的关系。
JAMA Netw Open. 2018 Aug 3;1(4):e181535. doi: 10.1001/jamanetworkopen.2018.1535.
2
Deep Learning-Based Assessment of Built Environment From Satellite Images and Cardiometabolic Disease Prevalence.基于深度学习的卫星图像与心血管代谢疾病患病率的建筑环境评估。
JAMA Cardiol. 2024 Jun 1;9(6):556-564. doi: 10.1001/jamacardio.2024.0749.
3
Built Environment Features Obtained from Google Street View Are Associated with Coronary Artery Disease Prevalence: A Deep-Learning Framework.通过谷歌街景获取的建成环境特征与冠状动脉疾病患病率相关:一个深度学习框架。
medRxiv. 2023 Mar 29:2023.03.28.23287888. doi: 10.1101/2023.03.28.23287888.
4
Artificial intelligence-based assessment of built environment from Google Street View and coronary artery disease prevalence.基于谷歌街景的人工智能评估建筑环境与冠心病患病率的关系。
Eur Heart J. 2024 May 7;45(17):1540-1549. doi: 10.1093/eurheartj/ehae158.
5
Health and the built environment in United States cities: measuring associations using Google Street View-derived indicators of the built environment.美国城市的健康与建筑环境:使用谷歌街景衍生的建筑环境指标来衡量关联。
BMC Public Health. 2020 Feb 12;20(1):215. doi: 10.1186/s12889-020-8300-1.
6
Association of Number of Indoor Tanning Salons With Neighborhoods With Higher Concentrations of Male-Male Partnered Households.与男性同性伴侣家庭比例较高的邻里地区室内晒黑沙龙数量的关联。
JAMA Netw Open. 2019 Oct 2;2(10):e1912443. doi: 10.1001/jamanetworkopen.2019.12443.
7
Using Convolutional Neural Networks to Derive Neighborhood Built Environments from Google Street View Images and Examine Their Associations with Health Outcomes.利用卷积神经网络从谷歌街景图像中提取邻里建成环境并研究其与健康结果的关系。
Int J Environ Res Public Health. 2022 Sep 24;19(19):12095. doi: 10.3390/ijerph191912095.
8
Quantification of Neighborhood-Level Social Determinants of Health in the Continental United States.量化美国大陆邻里健康社会决定因素。
JAMA Netw Open. 2020 Jan 3;3(1):e1919928. doi: 10.1001/jamanetworkopen.2019.19928.
9
Using Satellite Images and Deep Learning to Identify Associations Between County-Level Mortality and Residential Neighborhood Features Proximal to Schools: A Cross-Sectional Study.利用卫星图像和深度学习识别县死亡率与学校周边居住社区特征之间的关联:一项横断面研究。
Front Public Health. 2021 Nov 5;9:766707. doi: 10.3389/fpubh.2021.766707. eCollection 2021.
10
Race/Ethnicity and Geographic Access to Urban Trauma Care.种族/民族和地理上获得城市创伤护理。
JAMA Netw Open. 2019 Mar 1;2(3):e190138. doi: 10.1001/jamanetworkopen.2019.0138.

引用本文的文献

1
Obesity: Clinical Impact, Pathophysiology, Complications, and Modern Innovations in Therapeutic Strategies.肥胖症:临床影响、病理生理学、并发症及治疗策略的现代创新
Medicines (Basel). 2025 Jul 28;12(3):19. doi: 10.3390/medicines12030019.
2
Artificial intelligence in the management of metabolic disorders: a comprehensive review.人工智能在代谢紊乱管理中的应用:综述
J Endocrinol Invest. 2025 Feb 19. doi: 10.1007/s40618-025-02548-x.
3
Harnessing Artificial Intelligence in Obesity Research and Management: A Comprehensive Review.

本文引用的文献

1
Neighbourhood looking glass: 360º automated characterisation of the built environment for neighbourhood effects research.邻里观察镜:用于邻里效应研究的 360°自动构建环境特征描述。
J Epidemiol Community Health. 2018 Mar;72(3):260-266. doi: 10.1136/jech-2017-209456. Epub 2018 Jan 15.
2
Prevalence of Obesity Among Adults and Youth: United States, 2015-2016.2015 - 2016年美国成年人及青少年肥胖症患病率
NCHS Data Brief. 2017 Oct(288):1-8.
3
Convergence between biological, behavioural and genetic determinants of obesity.肥胖的生物学、行为学和遗传学决定因素的趋同。
肥胖研究与管理中人工智能的应用:综述
Diagnostics (Basel). 2025 Feb 6;15(3):396. doi: 10.3390/diagnostics15030396.
4
Geospatial Modeling of Deep Neural Visual Features for Predicting Obesity Prevalence in Missouri: Quantitative Study.用于预测密苏里州肥胖患病率的深度神经视觉特征地理空间建模:定量研究
JMIR AI. 2024 Dec 17;3:e64362. doi: 10.2196/64362.
5
AI-Facilitated Assessment of Built Environment Using Neighborhood Satellite Imagery and Cardiovascular Risk.基于邻里卫星图像的人工智能辅助评估建筑环境与心血管风险
J Am Coll Cardiol. 2024 Oct 29;84(18):1733-1744. doi: 10.1016/j.jacc.2024.08.053.
6
Examining noncommunicable diseases using satellite imagery: a systematic literature review.利用卫星图像检测非传染性疾病:系统文献综述。
BMC Public Health. 2024 Oct 10;24(1):2774. doi: 10.1186/s12889-024-20316-z.
7
Neighborhood Characteristics Related to Changes in Anthropometrics During a Lifestyle Intervention for Persons with Obesity.与肥胖人群生活方式干预期间人体测量学变化相关的邻里特征
Int J Behav Med. 2025 Feb;32(1):58-68. doi: 10.1007/s12529-024-10317-y. Epub 2024 Sep 11.
8
Combination of Machine Learning Techniques to Predict Overweight/Obesity in Adults.结合机器学习技术预测成年人超重/肥胖情况
J Pers Med. 2024 Jul 31;14(8):816. doi: 10.3390/jpm14080816.
9
Associations of Longitudinal BMI-Percentile Classification Patterns in Early Childhood with Neighborhood-Level Social Determinants of Health.幼儿期纵向BMI百分位数分类模式与邻里层面健康社会决定因素的关联。
Child Obes. 2025 Jan;21(1):65-75. doi: 10.1089/chi.2023.0157. Epub 2024 Aug 26.
10
Development and Maturation of the Human Brain, from Infancy to Adolescence.人类大脑的发育和成熟,从婴儿期到青春期。
Curr Top Behav Neurosci. 2024;68:327-348. doi: 10.1007/7854_2024_514.
Nat Rev Genet. 2017 Dec;18(12):731-748. doi: 10.1038/nrg.2017.72. Epub 2017 Oct 9.
4
Health Effects of Overweight and Obesity in 195 Countries over 25 Years.25年间195个国家超重和肥胖对健康的影响
N Engl J Med. 2017 Jul 6;377(1):13-27. doi: 10.1056/NEJMoa1614362. Epub 2017 Jun 12.
5
Dermatologist-level classification of skin cancer with deep neural networks.基于深度神经网络的皮肤癌皮肤科医生级分类。
Nature. 2017 Feb 2;542(7639):115-118. doi: 10.1038/nature21056. Epub 2017 Jan 25.
6
Combining satellite imagery and machine learning to predict poverty.结合卫星图像和机器学习预测贫困。
Science. 2016 Aug 19;353(6301):790-4. doi: 10.1126/science.aaf7894.
7
Prevalence of physical activity and obesity in US counties, 2001-2011: a road map for action.美国各县 2001-2011 年体力活动与肥胖症的流行状况:行动路线图。
Popul Health Metr. 2013 Jul 10;11:7. doi: 10.1186/1478-7954-11-7. eCollection 2013.
8
Association between body-mass index and risk of death in more than 1 million Asians.超过 100 万亚洲人身体质量指数与死亡风险的关联。
N Engl J Med. 2011 Feb 24;364(8):719-29. doi: 10.1056/NEJMoa1010679.
9
Validity of self-reported height, weight, and body mass index: findings from the National Health and Nutrition Examination Survey, 2001-2006.自我报告的身高、体重和体重指数的有效性:2001 - 2006年国家健康与营养检查调查结果
Prev Chronic Dis. 2009 Oct;6(4):A121. Epub 2009 Sep 15.
10
Built environments and obesity in disadvantaged populations.弱势人群的建成环境与肥胖
Epidemiol Rev. 2009;31:7-20. doi: 10.1093/epirev/mxp005. Epub 2009 Jul 9.