• 文献检索
  • 文档翻译
  • 深度研究
  • 学术资讯
  • Suppr Zotero 插件Zotero 插件
  • 邀请有礼
  • 套餐&价格
  • 历史记录
应用&插件
Suppr Zotero 插件Zotero 插件浏览器插件Mac 客户端Windows 客户端微信小程序
定价
高级版会员购买积分包购买API积分包
服务
文献检索文档翻译深度研究API 文档MCP 服务
关于我们
关于 Suppr公司介绍联系我们用户协议隐私条款
关注我们

Suppr 超能文献

核心技术专利:CN118964589B侵权必究
粤ICP备2023148730 号-1Suppr @ 2026

文献检索

告别复杂PubMed语法,用中文像聊天一样搜索,搜遍4000万医学文献。AI智能推荐,让科研检索更轻松。

立即免费搜索

文件翻译

保留排版,准确专业,支持PDF/Word/PPT等文件格式,支持 12+语言互译。

免费翻译文档

深度研究

AI帮你快速写综述,25分钟生成高质量综述,智能提取关键信息,辅助科研写作。

立即免费体验

基于 MODIS AOD 和 NAQPMS 数据估算京津冀地区的 PM 浓度。

Estimating PM Concentrations Based on MODIS AOD and NAQPMS Data over Beijing⁻Tianjin⁻Hebei.

机构信息

College of Geomatics, Shandong University of Science and Technology, Qingdao 266590, China.

State Key Laboratory of Remote Sensing Science, Institute of Remote Sensing and Digital Earth of Chinese Academy of Sciences, Beijing 100101, China.

出版信息

Sensors (Basel). 2019 Mar 9;19(5):1207. doi: 10.3390/s19051207.

DOI:10.3390/s19051207
PMID:30857313
原文链接:https://pmc.ncbi.nlm.nih.gov/articles/PMC6427133/
Abstract

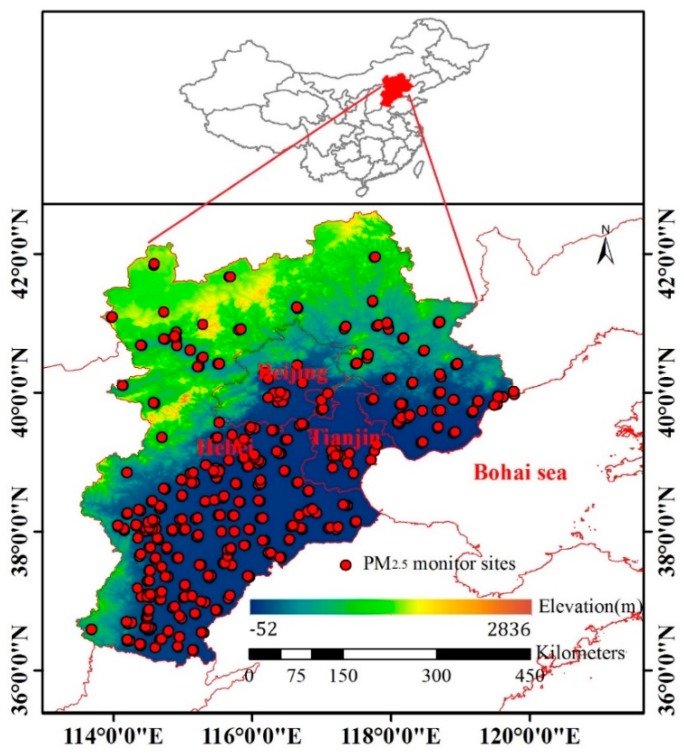
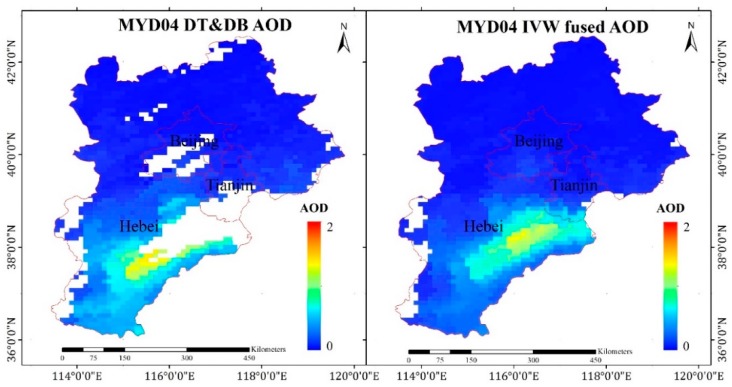
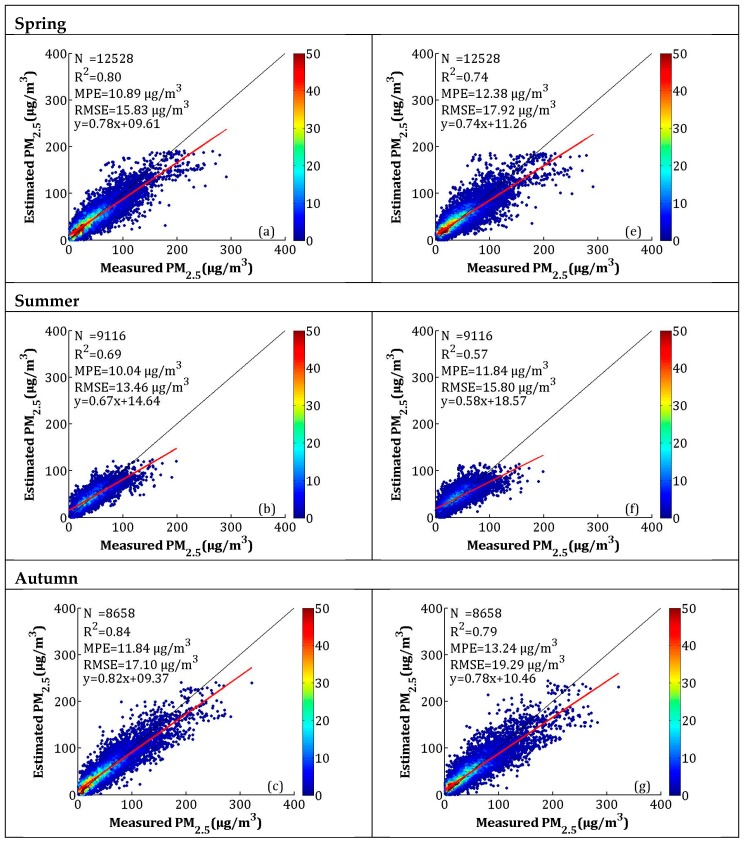
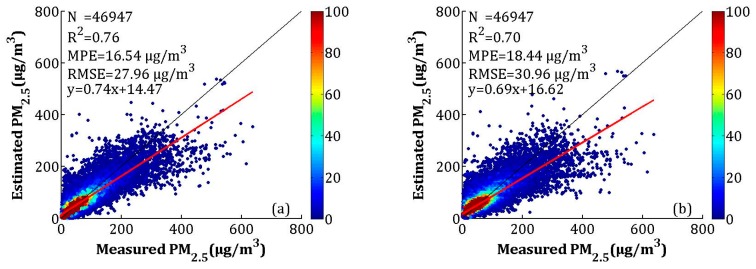
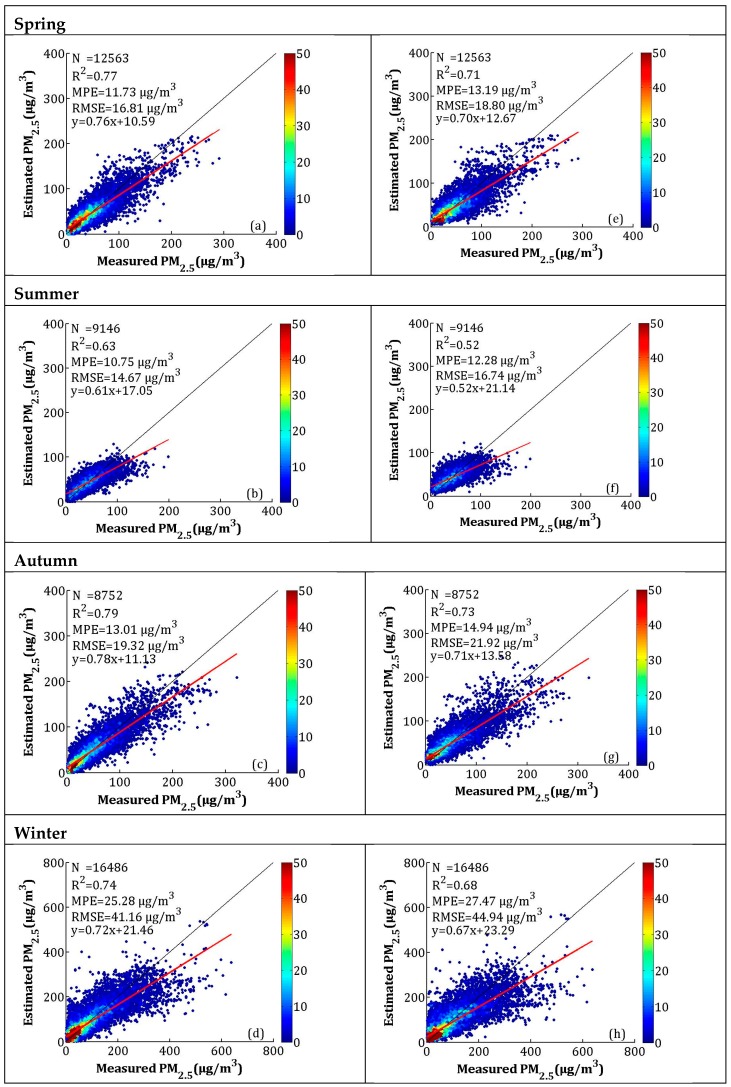
Accurately estimating fine ambient particulate matter (PM) is important to assess air quality and to support epidemiological studies. To analyze the spatiotemporal variation of PM concentrations, previous studies used different methodologies, such as statistical models or neural networks, to estimate PM. However, there is little research on full-coverage PM estimation using a combination of ground-measured, satellite-estimated, and atmospheric chemical model data. In this study, the linear mixed effect (LME) model, which used the aerosol optical depth (AOD) from the Moderate Resolution Imaging Spectroradiometer (MODIS), meteorological data, normalized difference vegetation index (NDVI), and elevation data as predictors, was fitted for 2017 over Beijing⁻Tianjin⁻Hebei (BTH). The LME model was used to calibrate the PM concentration using the nested air-quality prediction modeling system (NAQPMS) simulated with ground measurements. The inverse variance weighting (IVW) method was used to fuse satellite-estimated and model-calibrated PM. The results showed a strong agreement with ground measurements, with an overall coefficient (²) of 0.78 and a root-mean-square error (RMSE) of 26.44 μg/m³ in cross-validation (CV). The seasonal ² values were 0.75, 0.62, 0.80, and 0.78 in the spring, summer, autumn, and winter, respectively. The fusion results supplement the lack of satellite estimates and can capture more detailed information than the NAQPMS model. Therefore, the results will be helpful for pollution process analyses and health-related studies.

摘要

准确估计细颗粒物(PM)对于评估空气质量和支持流行病学研究非常重要。为了分析 PM 浓度的时空变化,先前的研究使用了不同的方法,如统计模型或神经网络,来估计 PM。然而,使用地面测量、卫星估计和大气化学模型数据的组合来进行全面覆盖的 PM 估计的研究很少。在这项研究中,使用了线性混合效应(LME)模型,该模型使用了中分辨率成像光谱仪(MODIS)的气溶胶光学深度(AOD)、气象数据、归一化差异植被指数(NDVI)和海拔数据作为预测因子,对 2017 年京津冀地区进行了拟合。LME 模型用于校准使用地面测量模拟的嵌套空气质量预测建模系统(NAQPMS)中 PM 浓度。逆方差加权(IVW)方法用于融合卫星估计和模型校准的 PM。结果与地面测量数据具有很强的一致性,交叉验证的总体系数(²)为 0.78,均方根误差(RMSE)为 26.44μg/m³。在春季、夏季、秋季和冬季,季节 ² 值分别为 0.75、0.62、0.80 和 0.78。融合结果补充了卫星估计的不足,可以比 NAQPMS 模型更准确地捕捉更详细的信息。因此,这些结果将有助于污染过程分析和与健康相关的研究。

https://cdn.ncbi.nlm.nih.gov/pmc/blobs/836b/6427133/5a43301aa03f/sensors-19-01207-g012a.jpg
https://cdn.ncbi.nlm.nih.gov/pmc/blobs/836b/6427133/109a0ef723a1/sensors-19-01207-g001.jpg
https://cdn.ncbi.nlm.nih.gov/pmc/blobs/836b/6427133/c5c37ab05816/sensors-19-01207-g002.jpg
https://cdn.ncbi.nlm.nih.gov/pmc/blobs/836b/6427133/3e3bf752ae9b/sensors-19-01207-g003.jpg
https://cdn.ncbi.nlm.nih.gov/pmc/blobs/836b/6427133/0eaab9aa1731/sensors-19-01207-g004.jpg
https://cdn.ncbi.nlm.nih.gov/pmc/blobs/836b/6427133/4efa8fa7a97c/sensors-19-01207-g005.jpg
https://cdn.ncbi.nlm.nih.gov/pmc/blobs/836b/6427133/a1b7a2101da3/sensors-19-01207-g006.jpg
https://cdn.ncbi.nlm.nih.gov/pmc/blobs/836b/6427133/96b5bd4975f6/sensors-19-01207-g007a.jpg
https://cdn.ncbi.nlm.nih.gov/pmc/blobs/836b/6427133/ae35ebd7890e/sensors-19-01207-g008.jpg
https://cdn.ncbi.nlm.nih.gov/pmc/blobs/836b/6427133/012c7f644d8f/sensors-19-01207-g009.jpg
https://cdn.ncbi.nlm.nih.gov/pmc/blobs/836b/6427133/500e9d6ec5e7/sensors-19-01207-g010.jpg
https://cdn.ncbi.nlm.nih.gov/pmc/blobs/836b/6427133/bbcbbf741229/sensors-19-01207-g011a.jpg
https://cdn.ncbi.nlm.nih.gov/pmc/blobs/836b/6427133/5a43301aa03f/sensors-19-01207-g012a.jpg

相似文献

1
Estimating PM Concentrations Based on MODIS AOD and NAQPMS Data over Beijing⁻Tianjin⁻Hebei.基于 MODIS AOD 和 NAQPMS 数据估算京津冀地区的 PM 浓度。
Sensors (Basel). 2019 Mar 9;19(5):1207. doi: 10.3390/s19051207.
2
Assessment and statistical modeling of the relationship between remotely sensed aerosol optical depth and PM2.5 in the eastern United States.美国东部地区遥感气溶胶光学厚度与PM2.5之间关系的评估及统计建模
Res Rep Health Eff Inst. 2012 May(167):5-83; discussion 85-91.
3
Daily estimation of ground-level PM concentrations at 4km resolution over Beijing-Tianjin-Hebei by fusing MODIS AOD and ground observations.利用 MODIS AOD 与地面观测融合方法实现北京-天津-河北地区地面 PM2.5 浓度的 4km 分辨率逐日估算。
Sci Total Environ. 2017 Feb 15;580:235-244. doi: 10.1016/j.scitotenv.2016.12.049. Epub 2016 Dec 13.
4
Application of satellite remote sensing data and random forest approach to estimate ground-level PM concentration in Northern region of Thailand.应用卫星遥感数据和随机森林方法估算泰国北部地区的地面 PM 浓度。
Environ Sci Pollut Res Int. 2023 Aug;30(38):88905-88917. doi: 10.1007/s11356-023-28698-0. Epub 2023 Jul 13.
5
Estimating ground-level PM concentrations by developing and optimizing machine learning and statistical models using 3 km MODIS AODs: case study of Tehran, Iran.利用3公里分辨率的中分辨率成像光谱仪(MODIS)气溶胶光学厚度(AOD)开发和优化机器学习及统计模型来估算地面颗粒物(PM)浓度:以伊朗德黑兰为例
J Environ Health Sci Eng. 2021 Feb 2;19(1):1-21. doi: 10.1007/s40201-020-00509-5. eCollection 2021 Jun.
6
Incorporating long-term satellite-based aerosol optical depth, localized land use data, and meteorological variables to estimate ground-level PM concentrations in Taiwan from 2005 to 2015.利用长期卫星气溶胶光学深度、本地化土地利用数据和气象变量来估算 2005 年至 2015 年台湾地区地面 PM 浓度。
Environ Pollut. 2018 Jun;237:1000-1010. doi: 10.1016/j.envpol.2017.11.016. Epub 2017 Nov 20.
7
[High-resolution Estimation of Spatio-temporal Variation in PM Concentrations in the Beijing-Tianjin-Hebei Region].[京津冀地区细颗粒物浓度时空变化的高分辨率估算]
Huan Jing Ke Xue. 2021 Sep 8;42(9):4083-4094. doi: 10.13227/j.hjkx.202012197.
8
Estimating PM2.5 in Xi'an, China using aerosol optical depth: a comparison between the MODIS and MISR retrieval models.利用气溶胶光学厚度估算中国西安的 PM2.5:MODIS 和 MISR 反演模型的比较。
Sci Total Environ. 2015 Feb 1;505:1156-65. doi: 10.1016/j.scitotenv.2014.11.024. Epub 2014 Nov 20.
9
Estimating national-scale ground-level PM25 concentration in China using geographically weighted regression based on MODIS and MISR AOD.基于中分辨率成像光谱仪(MODIS)和多角度成像光谱辐射计(MISR)气溶胶光学厚度,运用地理加权回归法估算中国全国尺度的地面细颗粒物(PM2.5)浓度。
Environ Sci Pollut Res Int. 2016 May;23(9):8327-38. doi: 10.1007/s11356-015-6027-9. Epub 2016 Jan 16.
10
Satellite-Based Spatiotemporal Trends in PM2.5 Concentrations: China, 2004-2013.2004 - 2013年中国基于卫星的PM2.5浓度时空趋势
Environ Health Perspect. 2016 Feb;124(2):184-92. doi: 10.1289/ehp.1409481. Epub 2015 Jul 24.

引用本文的文献

1
24-hour average PM2.5 concentration caused by aircraft in Chinese airports from Jan. 2006 to Dec. 2023.2006 年 1 月至 2023 年 12 月中国机场飞机产生的 24 小时平均 PM2.5 浓度。
Sci Data. 2024 Mar 9;11(1):284. doi: 10.1038/s41597-024-03110-9.
2
A PPG-Based Calibration-Free Cuffless Blood Pressure Estimation Method Using Cardiovascular Dynamics.基于 PPG 的无袖带血压估计方法,利用心血管动力学。
Sensors (Basel). 2023 Apr 21;23(8):4145. doi: 10.3390/s23084145.
3
Prediction of COVID-19 Cases from the Nexus of Air Quality and Meteorological Phenomena: Bangladesh Perspective.

本文引用的文献

1
Satellite-Based Estimation of Hourly PM Concentrations Using a Vertical-Humidity Correction Method from Himawari-AOD in Hebei.基于卫星的逐小时 PM 浓度估算:利用 Himawari-AOD 的垂直湿度订正方法在河北的应用。
Sensors (Basel). 2018 Oct 14;18(10):3456. doi: 10.3390/s18103456.
2
Importance of mineral dust and anthropogenic pollutants mixing during a long-lasting high PM event over East Asia.重要的是矿物质尘埃和人为污染物混合在一个持久的高 PM 事件在东亚。
Environ Pollut. 2018 Mar;234:368-378. doi: 10.1016/j.envpol.2017.11.068. Epub 2017 Dec 21.
3
Improving satellite-driven PM models with Moderate Resolution Imaging Spectroradiometer fire counts in the southeastern U.S.
从空气质量与气象现象的关系预测新冠疫情病例:孟加拉国视角
Earth Syst Environ. 2022;6(1):307-325. doi: 10.1007/s41748-021-00278-7. Epub 2021 Nov 28.
4
An IoT enabled system for enhanced air quality monitoring and prediction on the edge.一种用于在边缘增强空气质量监测和预测的物联网系统。
Complex Intell Systems. 2021;7(6):2923-2947. doi: 10.1007/s40747-021-00476-w. Epub 2021 Jul 29.
5
Particulate Air Pollution and Osteoporosis: A Systematic Review.颗粒物空气污染与骨质疏松症:一项系统综述。
Risk Manag Healthc Policy. 2021 Jun 24;14:2715-2732. doi: 10.2147/RMHP.S316429. eCollection 2021.
6
Estimation of ground-level PM2.5 concentration using MODIS AOD and corrected regression model over Beijing, China.利用 MODIS AOD 和校正回归模型估算中国北京地区的地面 PM2.5 浓度。
PLoS One. 2020 Oct 13;15(10):e0240430. doi: 10.1371/journal.pone.0240430. eCollection 2020.
7
Robust Confidence Intervals for PM Concentration Measurements in the Ecuadorian Park La Carolina.厄瓜多尔卡罗莱纳公园中 PM 浓度测量的稳健置信区间。
Sensors (Basel). 2020 Jan 24;20(3):654. doi: 10.3390/s20030654.
利用中分辨率成像光谱仪火灾计数改进美国东南部基于卫星的颗粒物模型
J Geophys Res Atmos. 2014 Oct 16;119(19):11375-11386. doi: 10.1002/2014JD021920. Epub 2014 Oct 8.
4
Estimating daily PM and PM across the complex geo-climate region of Israel using MAIAC satellite-based AOD data.利用基于MAIAC卫星的气溶胶光学厚度(AOD)数据估算以色列复杂地理气候区域的每日细颗粒物(PM)和颗粒物(PM)。
Atmos Environ (1994). 2015 Dec;122:409-416. doi: 10.1016/j.atmosenv.2015.10.004. Epub 2015 Oct 8.
5
Fine particulate matter and cardiovascular disease: Comparison of assessment methods for long-term exposure.细颗粒物与心血管疾病:长期暴露评估方法的比较
Environ Res. 2017 Nov;159:16-23. doi: 10.1016/j.envres.2017.07.041. Epub 2017 Jul 29.
6
Evaluation of a data fusion approach to estimate daily PM levels in North China.一种用于估算中国北方每日细颗粒物(PM)水平的数据融合方法的评估
Environ Res. 2017 Oct;158:54-60. doi: 10.1016/j.envres.2017.06.001. Epub 2017 Jul 3.
7
Interactions between cigarette smoking and ambient PM for cardiovascular mortality.吸烟与环境细颗粒物对心血管疾病死亡率的相互作用。
Environ Res. 2017 Apr;154:304-310. doi: 10.1016/j.envres.2017.01.024. Epub 2017 Jan 28.
8
Daily estimation of ground-level PM concentrations at 4km resolution over Beijing-Tianjin-Hebei by fusing MODIS AOD and ground observations.利用 MODIS AOD 与地面观测融合方法实现北京-天津-河北地区地面 PM2.5 浓度的 4km 分辨率逐日估算。
Sci Total Environ. 2017 Feb 15;580:235-244. doi: 10.1016/j.scitotenv.2016.12.049. Epub 2016 Dec 13.
9
Comparing the Health Effects of Ambient Particulate Matter Estimated Using Ground-Based versus Remote Sensing Exposure Estimates.比较使用地面监测与遥感估算的环境颗粒物暴露量对健康的影响。
Environ Health Perspect. 2017 Apr;125(4):552-559. doi: 10.1289/EHP575. Epub 2016 Sep 9.
10
Spatial-temporal characteristics and determinants of PM2.5 in the Bohai Rim Urban Agglomeration.环渤海城市群细颗粒物(PM2.5)的时空特征及影响因素
Chemosphere. 2016 Apr;148:148-62. doi: 10.1016/j.chemosphere.2015.12.118. Epub 2016 Jan 21.