Robertson Jane, Iwamoto Kotoji, Hoxha Iris, Ghazaryan Lilit, Abilova Vafa, Cvijanovic Ana, Pyshnik Halina, Darakhvelidze Marina, Makalkina Larissa, Jakupi Arianit, Dzhakubekova Aigul, Carp Angela, Cizmovic Lidija, Rachina Svetlana, Radonjic Vesela, Yusufi Salomudin, Aksoy Mesil, Ibragimova Muhabbat, Godman Brian, Kluge Hans, Pedersen Hanne Bak
World Health Organization Regional Office for Europe, Copenhagen, Denmark.
Department of Clinical Pharmacology, The University of Newcastle, Callaghan, NSW, Australia.
Front Pharmacol. 2019 Mar 5;9:1156. doi: 10.3389/fphar.2018.01156. eCollection 2018.
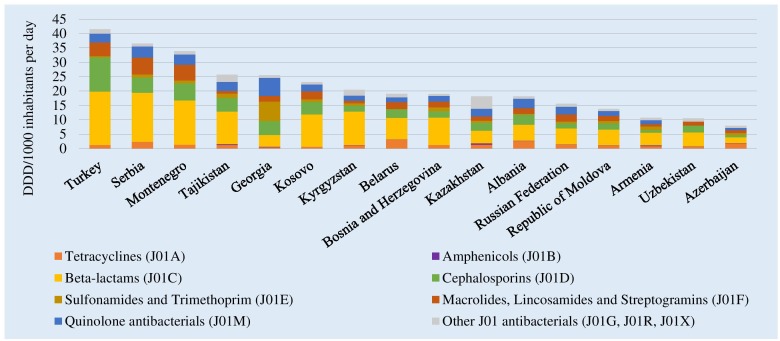
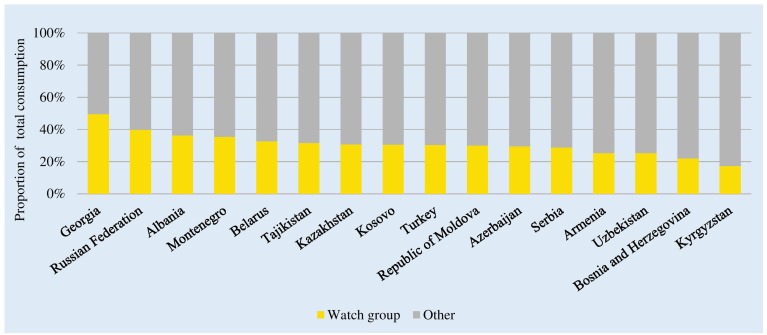
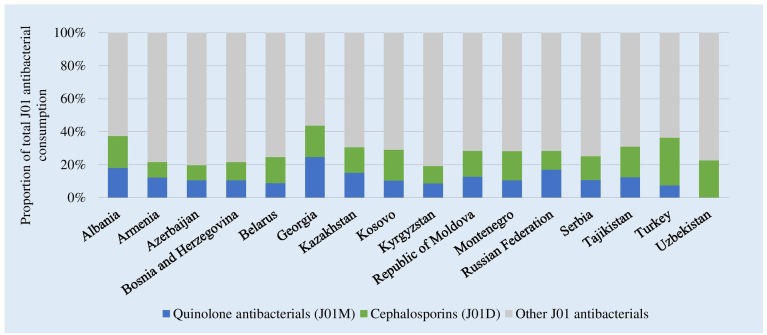
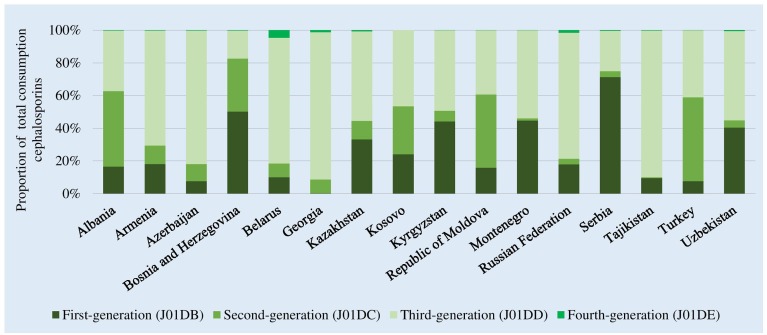
Surveillance of antimicrobial medicines consumption is central to improving their use and reducing resistance rates. There are few published data on antibiotic consumption in Eastern Europe and Central Asia. To address this, 18 non-European Union (EU) countries and territories contribute to the WHO Regional Office for Europe (WHO Europe) Antimicrobial Medicines Consumption (AMC) Network. (i) Analyze 2015 consumption of J01 class antibacterials for systemic use from 16 AMC Network members; (ii) compare results with 2011 data and 2015 ESAC-Net estimates; (iii) assess consumption against suggested indicators; (iv) evaluate the impact of planned changes to defined daily doses (DDDs) in 2019 for some commonly used antibiotics; and (v) consider the utility of quantitative metrics of consumption for policy action. Analysis methods are similar to ESAC-Net for EU countries. The Anatomical Therapeutic Chemical (ATC) classification and DDD methodology were used to calculate total consumption (DDD/1000 inhabitants/day [DID]), relative use measures (percentages), extent of use of WHO Watch and Reserve group antibiotics and impact of DDD changes. Total J01 consumption in 2015 ranged 8.0-41.5 DID (mean 21.2 DID), generally lower than in 2011 (6.4-42.3 DID, mean 23.6 DID). Beta-lactam penicillins, cephalosporins, and quinolones represented 16.2-56.6, 9.4-28.8, and 7.5-24.6% of total J01 consumption, respectively. Third-generation cephalosporins comprised up to 90% of total cephalosporin consumption in some countries. Consumption of WHO Reserve antibiotics was very low; Watch antibiotics comprised 17.3-49.5% of total consumption (mean 30.9%). Variability was similar to 2015 ESAC-Net data (11.7-38.3 DID; mean 22.6 DID). DDD changes in 2019 impact both total and relative consumption estimates: total DIDs reduced on average by 12.0% (7.3-35.5 DID), mostly due to reduced total DDDs for commonly used penicillins; impact on rankings and relative use estimates were modest. Quantitative metrics of antibiotic consumption have value. Improvements over time reflect national activities, however, changes in total volumes may conceal shifts to less desirable choices. Relative use measures targeting antibiotics of concern may be more informative. Some, including WHO Watch and Reserve classifications, lend themselves to prescribing targets supported by guidelines and treatment protocols.
监测抗菌药物的使用情况对于改善其使用方式和降低耐药率至关重要。关于东欧和中亚地区抗生素使用情况的公开数据很少。为了解决这一问题,18个非欧盟国家和地区向世界卫生组织欧洲区域办事处(世卫组织欧洲)抗菌药物使用情况(AMC)网络提供了数据。(i)分析了16个AMC网络成员2015年全身用J01类抗菌药物的使用情况;(ii)将结果与2011年数据及2015年欧洲抗菌药物消费监测网络(ESAC-Net)的估计数据进行比较;(iii)根据建议指标评估使用情况;(iv)评估2019年对某些常用抗生素的规定日剂量(DDD)计划变更的影响;(v)考虑使用量的定量指标对政策行动是否有用。分析方法与针对欧盟国家的ESAC-Net类似。采用解剖学治疗学化学(ATC)分类和DDD方法来计算总使用量(DDD/1000居民/天[DID])、相对使用量指标(百分比)、世卫组织观察类和储备类抗生素的使用范围以及DDD变化的影响。2015年J01类药物的总使用量在8.0 - 41.5 DID之间(平均为21.2 DID),总体低于2011年(6.4 - 42.3 DID,平均为23.6 DID)。β-内酰胺类青霉素、头孢菌素和喹诺酮类药物分别占J01类药物总使用量的16.2% - 56.6%、9.4% - 28.8%和7.5% - 24.6%。在一些国家,第三代头孢菌素占头孢菌素总使用量的比例高达90%。世卫组织储备类抗生素的使用量非常低;观察类抗生素占总使用量的17.3% - 49.5%(平均为30.9%)。其变化情况与2015年ESAC-Net数据类似(11.7 - 38.3 DID;平均为22.6 DID)。2019年DDD的变化对总使用量和相对使用量估计值均有影响:总DID平均减少了12.0%(7.3 - 35.5 DID),主要原因是常用青霉素的总DDD减少;对排名和相对使用量估计值的影响较小。抗生素使用量的定量指标具有价值。随着时间推移的改善反映了各国开展的活动,然而,总量的变化可能掩盖了向不太理想选择的转变。针对关注的抗生素的相对使用量指标可能更具参考价值。其中一些指标,包括世卫组织观察类和储备类分类,有助于制定指南和治疗方案所支持的处方目标。