Institut Curie, 26 rue d'Ulm, F-75005, Paris, France.
Inserm, U900, F-75005, Paris, France.
BMC Bioinformatics. 2019 Apr 18;20(Suppl 4):140. doi: 10.1186/s12859-019-2682-z.
The interplay between metabolic processes and signalling pathways remains poorly understood. Global, detailed and comprehensive reconstructions of human metabolism and signalling pathways exist in the form of molecular maps, but they have never been integrated together. We aim at filling in this gap by integrating of both signalling and metabolic pathways allowing a visual exploration of multi-level omics data and study of cross-regulatory circuits between these processes in health and in disease.
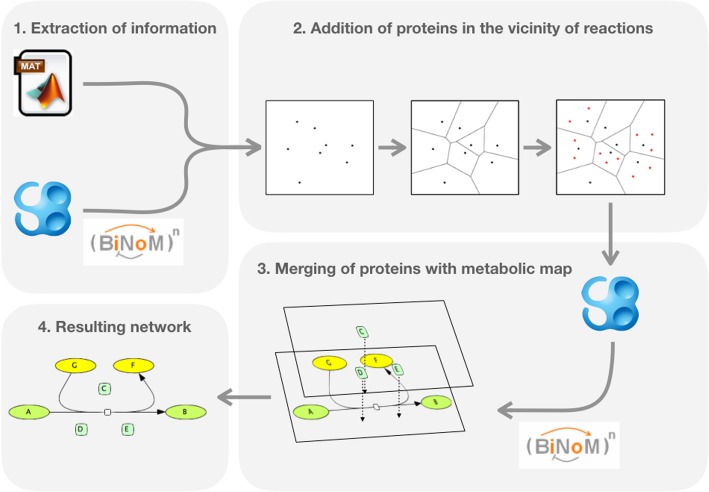
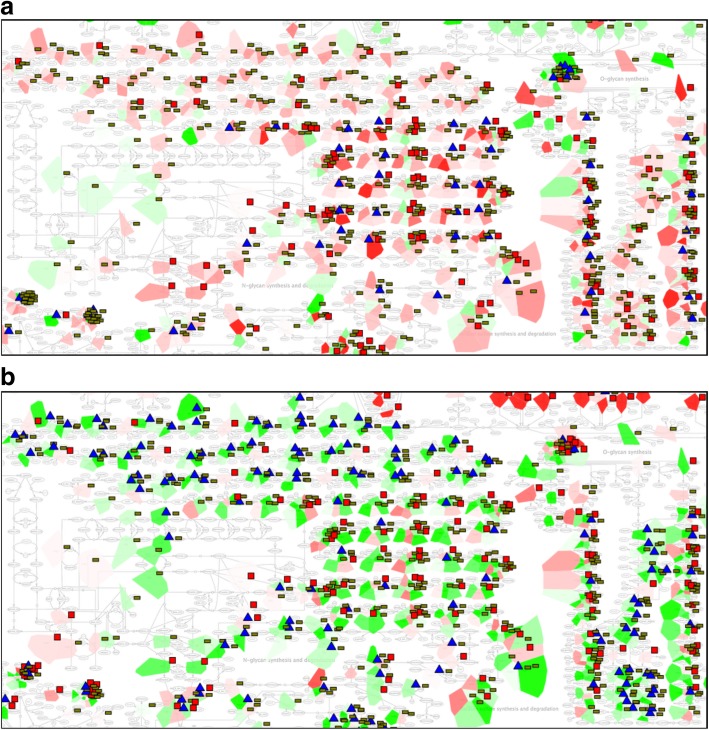
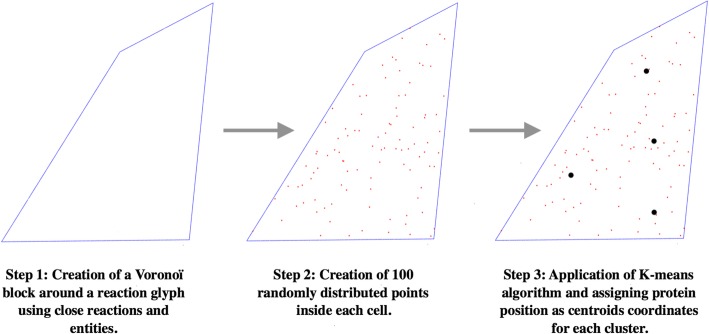
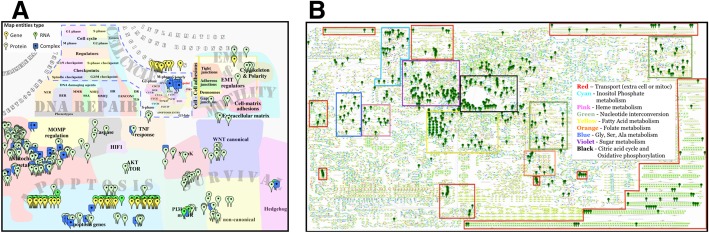
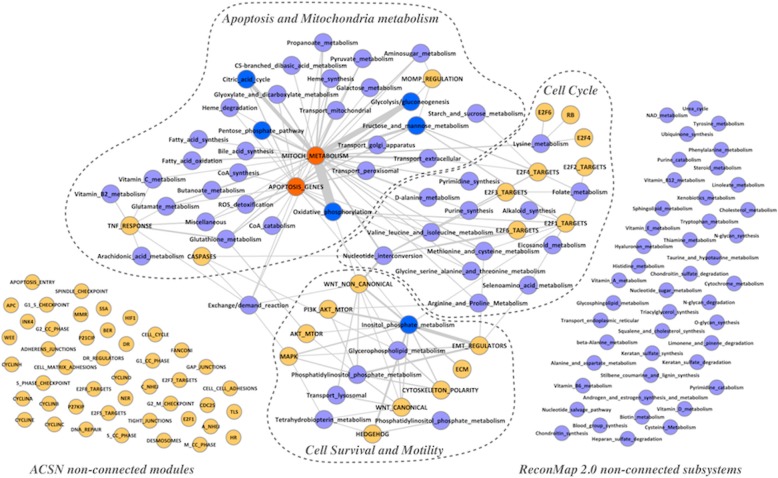
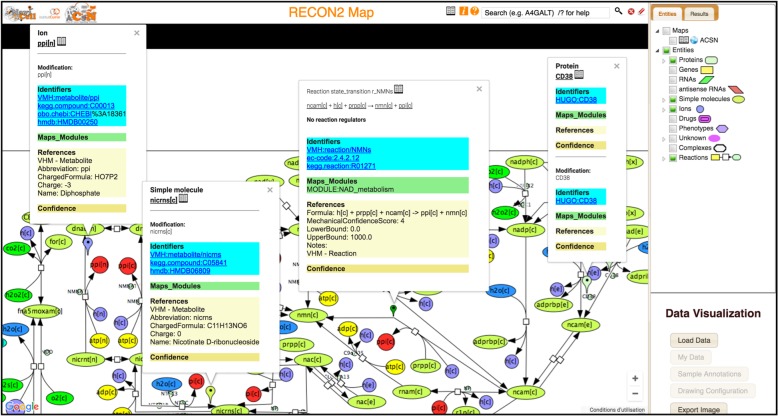
We combined two comprehensive manually curated network maps. Atlas of Cancer Signalling Network (ACSN), containing mechanisms frequently implicated in cancer; and ReconMap 2.0, a comprehensive reconstruction of human metabolic network. We linked ACSN and ReconMap 2.0 maps via common players and represented the two maps as interconnected layers using the NaviCell platform for maps exploration ( https://navicell.curie.fr/pages/maps_ReconMap%202.html ). In addition, proteins catalysing metabolic reactions in ReconMap 2.0 were not previously visually represented on the map canvas. This precluded visualisation of omics data in the context of ReconMap 2.0. We suggested a solution for displaying protein nodes on the ReconMap 2.0 map in the vicinity of the corresponding reaction or process nodes. This permits multi-omics data visualisation in the context of both map layers. Exploration and shuttling between the two map layers is possible using Google Maps-like features of NaviCell. The integrated networks ACSN-ReconMap 2.0 are accessible online and allows data visualisation through various modes such as markers, heat maps, bar-plots, glyphs and map staining. The integrated networks were applied for comparison of immunoreactive and proliferative ovarian cancer subtypes using transcriptomic, copy number and mutation multi-omics data. A certain number of metabolic and signalling processes specifically deregulated in each of the ovarian cancer sub-types were identified.
As knowledge evolves and new omics data becomes more heterogeneous, gathering together existing domains of biology under common platforms is essential. We believe that an integrated ACSN-ReconMap 2.0 networks will help in understanding various disease mechanisms and discovery of new interactions at the intersection of cell signalling and metabolism. In addition, the successful integration of metabolic and signalling networks allows broader systems biology approach application for data interpretation and retrieval of intervention points to tackle simultaneously the key players coordinating signalling and metabolism in human diseases.
代谢过程和信号通路之间的相互作用仍知之甚少。人类代谢和信号通路的全球、详细和全面重建以分子图谱的形式存在,但它们从未被整合在一起。我们的目标是通过整合信号和代谢途径来填补这一空白,从而可以可视化探索多组学数据,并研究这些过程在健康和疾病中的交叉调节回路。
我们结合了两个全面的人工 curated 网络图谱。癌症信号网络图谱(ACSN),包含经常涉及癌症的机制;以及 ReconMap 2.0,人类代谢网络的全面重建。我们通过共同参与者将 ACSN 和 ReconMap 2.0 图谱联系起来,并使用 NaviCell 平台(https://navicell.curie.fr/pages/maps_ReconMap%202.html)将两个图谱表示为相互连接的层。此外,ReconMap 2.0 中催化代谢反应的蛋白质以前在图谱画布上没有可视化表示。这排除了在 ReconMap 2.0 上下文中可视化组学数据的可能性。我们提出了一种在 ReconMap 2.0 图谱中对应反应或过程节点附近显示蛋白质节点的解决方案。这允许在两个图谱层的上下文中可视化多组学数据。使用 NaviCell 的类似 Google Maps 的功能可以在两个图谱层之间进行探索和穿梭。在线访问 ACSN-ReconMap 2.0 整合网络,并允许通过标记、热图、条形图、图元和图谱染色等多种模式进行数据可视化。整合网络应用于使用转录组学、拷贝数和突变多组学数据比较免疫反应性和增殖性卵巢癌亚型。确定了每个卵巢癌亚型中特定失调的一些代谢和信号过程。
随着知识的发展和新的组学数据变得更加多样化,将现有的生物学领域聚集在共同的平台下是至关重要的。我们相信,整合的 ACSN-ReconMap 2.0 网络将有助于理解各种疾病机制,并发现细胞信号和代谢交叉点的新相互作用。此外,代谢和信号网络的成功整合允许更广泛的系统生物学方法应用于数据解释和检索干预点,以同时解决协调人类疾病中信号和代谢的关键参与者。