Department of Bioengineering, University of California, Berkeley, CA 94720, USA.
Department of Physiology, University of Kentucky, Lexington, KY 40506, USA.
Magn Reson Imaging. 2019 Sep;61:83-89. doi: 10.1016/j.mri.2019.05.029. Epub 2019 May 21.
Cardiac native-T1 times have correlated to extracellular volume fraction in patients with confirmed fibrosis. However, whether other factors that can occur either alongside or independently of fibrosis including increased intracellular water volume, altered magnetization transfer (MT), or glycation of hemoglobin, lengthen T1 times in the absence of fibrosis remains unclear. The current study examined whether native-T1 times are elevated in hypertrophic diabetics with elevated hemoglobin A1C (HbA1c) without diffuse fibrosis.
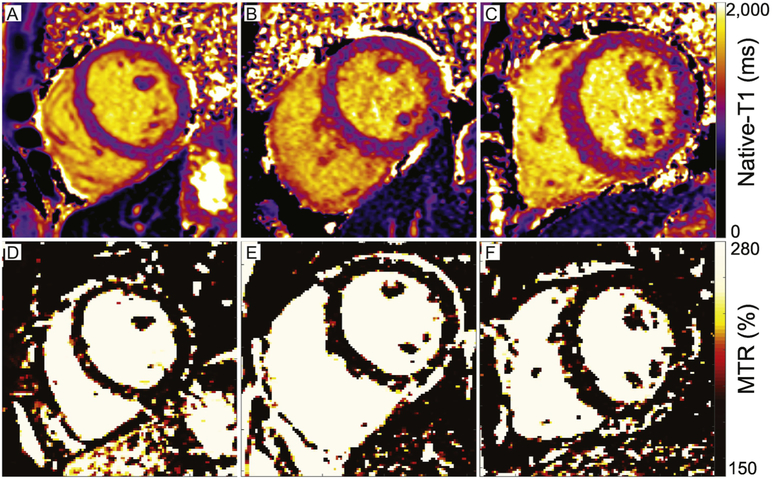
Native-T1 times were quantified in 27 diabetic and 10 healthy adults using a modified Look-Locker imaging (MOLLI) sequence at 1.5 T. The MT ratio (MTR) was quantified using dual flip angle cine balanced steady-state free precession. Gadolinium (0.2 mmol/kg Gd-DTPA) was administered as a bolus and post-contrast T1-times were quantified after 15 min. Means were compared using a two-tailed student's t-test, while correlations were assessed using Pearson's correlations.
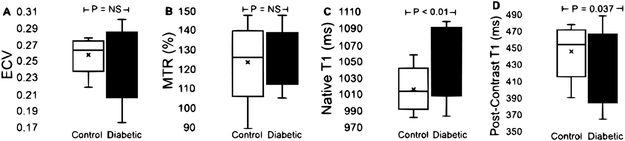
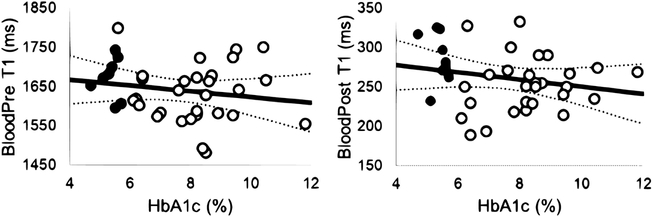
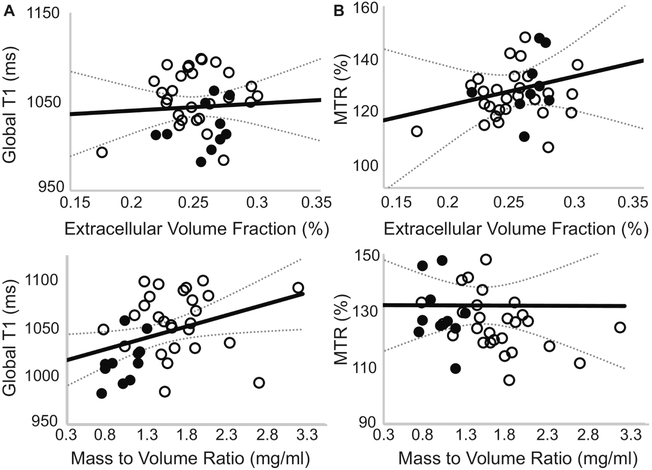
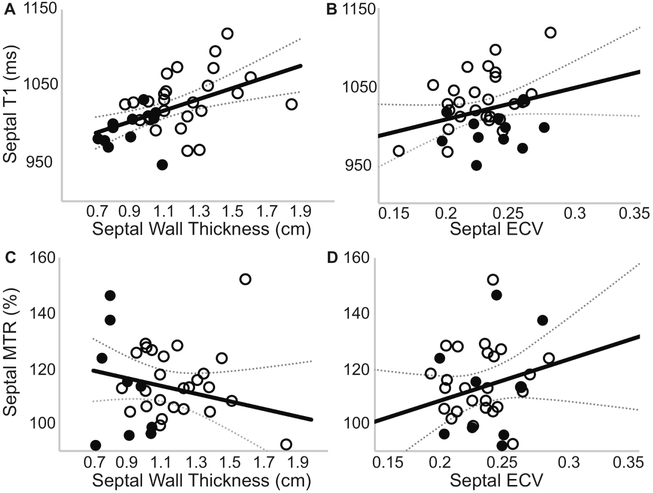
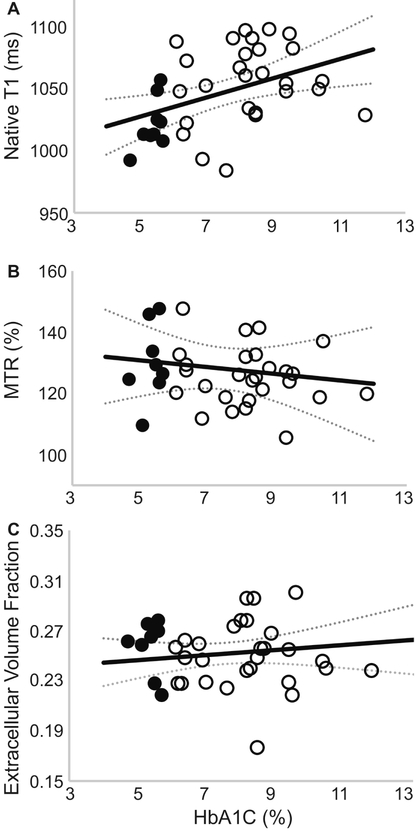
While left ventricular volumes, ejection fraction, and cardiac output were similar between groups, left ventricular mass and mass-to-volume ratio (MVR) were significantly higher in diabetic adults. Mean ECV (0.25 ± 0.02 Healthy vs. 0.25 ± 0.03 Diabetic, P = 0.47) and MTR (125 ± 16% Healthy vs. 125 ± 9% Diabetic, P = 0.97) were similar, however native-T1 times were significantly higher in diabetics (1016 ± 21 ms Healthy vs. 1056 ± 31 ms Diabetic, P = 0.00051). Global native-T1 times correlated with MVR (ρ = 0.43, P = 0.008) and plasma HbA1c levels (ρ = 0.43, P = 0.0088) but not ECV (ρ = 0.06, P = 0.73). Septal native-T1 times correlated with septal wall thickness (ρ = 0.50, P = 0.001).
In diabetic adults with normal ECV values, elevated native-T1 times may reflect increased intracellular water volume and changes secondary to increased hemoglobin glycation.
在已确诊纤维化的患者中,心脏的本征 T1 时间与细胞外容积分数相关。然而,其他可能与纤维化同时发生或独立发生的因素,包括细胞内水容积增加、磁化转移(MT)改变或血红蛋白糖化,是否会在没有纤维化的情况下延长 T1 时间仍不清楚。本研究检查了在血红蛋白 A1C(HbA1c)升高但无弥漫性纤维化的肥厚型糖尿病患者中,本征 T1 时间是否升高。
使用改良 Look-Locker 成像(MOLLI)序列在 1.5T 下对 27 名糖尿病患者和 10 名健康成年人进行本征 T1 时间定量。使用双翻转角电影平衡稳态自由进动定量 MT 比(MTR)。给予钆(0.2mmol/kg Gd-DTPA)作为推注剂,并在 15 分钟后定量对比后 T1 时间。使用双尾学生 t 检验比较平均值,使用 Pearson 相关性评估相关性。
尽管左心室容积、射血分数和心输出量在两组之间相似,但糖尿病患者的左心室质量和质量与容积比(MVR)明显更高。平均 ECV(0.25±0.02 健康组与 0.25±0.03 糖尿病组,P=0.47)和 MTR(125±16%健康组与 125±9%糖尿病组,P=0.97)相似,但糖尿病患者的本征 T1 时间明显更高(1016±21ms 健康组与 1056±31ms 糖尿病组,P=0.00051)。整体本征 T1 时间与 MVR(ρ=0.43,P=0.008)和血浆 HbA1c 水平(ρ=0.43,P=0.0088)相关,但与 ECV 无关(ρ=0.06,P=0.73)。间隔本征 T1 时间与间隔壁厚度相关(ρ=0.50,P=0.001)。
在 ECV 值正常的糖尿病患者中,升高的本征 T1 时间可能反映了细胞内水容积的增加以及血红蛋白糖化导致的继发性改变。