Livestock Sustainability Consultancy, Harwell, Didcot, Oxfordshire, UK.
Cady Agricultural Sustainability Specialties, Lake St Louis, MO.
J Anim Sci. 2020 Jan 1;98(1). doi: 10.1093/jas/skz291.
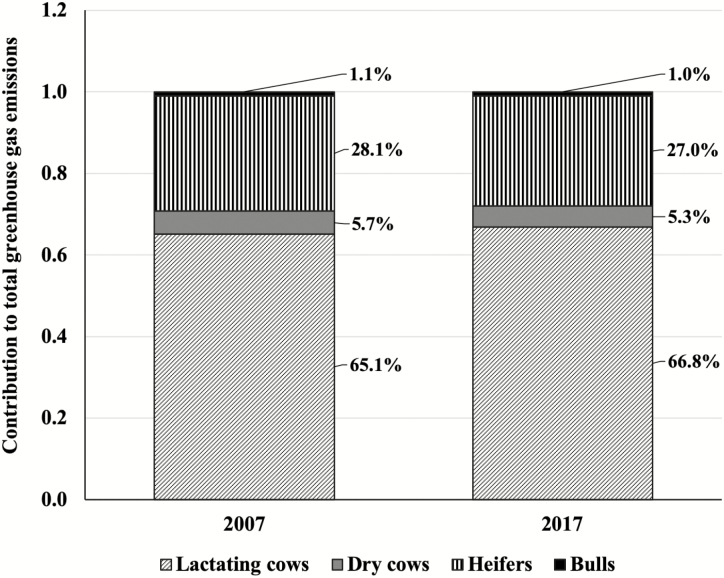
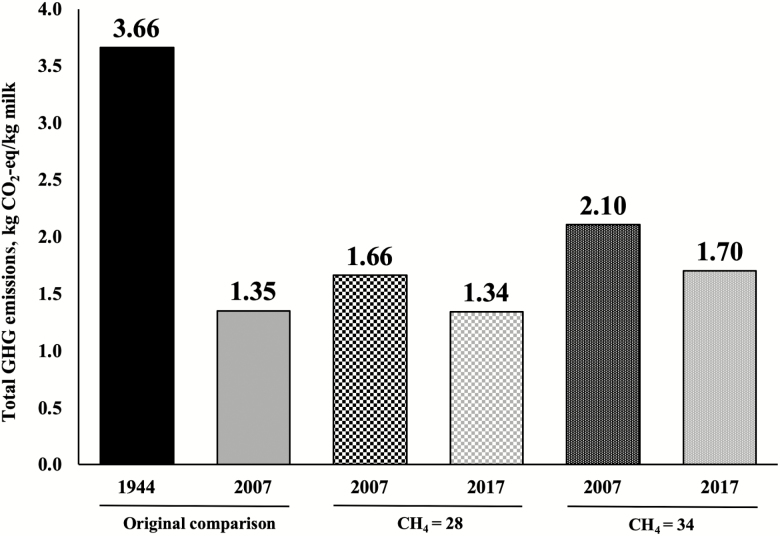
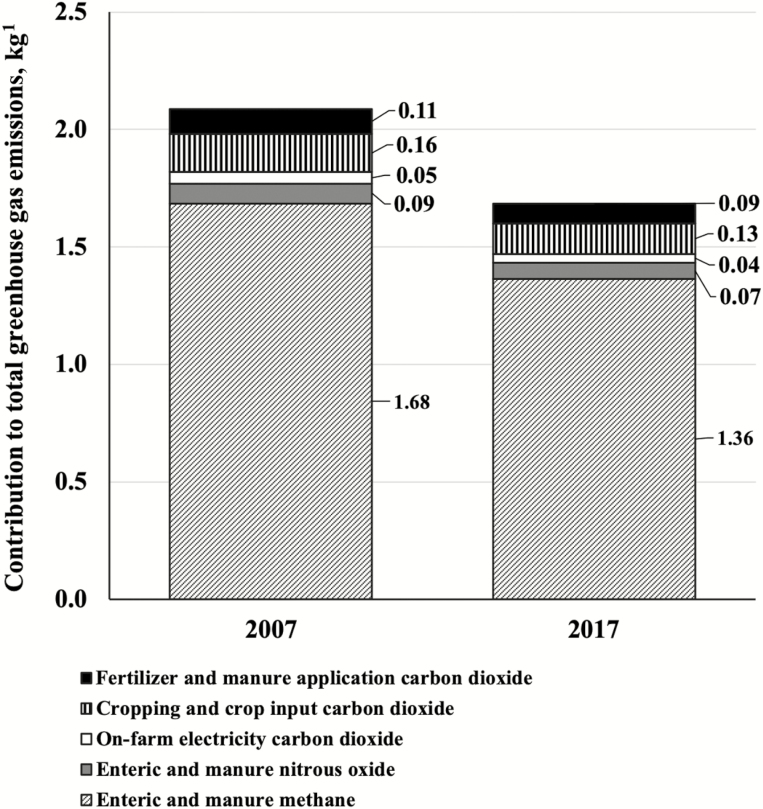
The U.S. dairy industry considerably reduced environmental impacts between 1944 and 2007, primarily through improved dairy cow productivity. However, although milk yield per cow has increased over the past decade, whole-system environmental impact analyses have not been conducted over this time period, during which environmental modeling science has improved considerably. The objective of this study was to compare the environmental impact of U.S. dairy cattle production in 2007-2017. A deterministic model based on population demographics, metabolism, and nutrient requirements of dairy cattle was used to estimate resource inputs, nutrient excretion, and greenhouse gas (GHG) emissions per 1.0 × 10⁶ t (one million metric t or MMT) of energy-corrected milk (ECM) produced in 2007 and 2017. System boundaries extended from the manufacture and transport of cropping inputs to milk at the farm gate. Milk transport, processing, and retail were not included. Dairy systems were modeled using typical management practices, herd population dynamics, and production data from U.S. dairy farms. Cropping data were sourced from national databases. The resources required to produce 1.0 MMT ECM in 2017 were considerably reduced relative to those required in 2007, with 2017 production systems using 74.8% of the cattle, 82.7% of the feedstuffs, 79.2% of the land, and 69.5% of the water as compared to 2007. Waste outputs were similarly reduced, with the 2017 U.S. dairy industry producing 79.4%, 82.5%, and 85.7% of the manure, N, and P excretion, respectively. Dairy production in 2017 emitted 80.9% of the CH4 and 81.5% of the N2O per 1.0 MMT ECM compared to 2007. Enteric and manure emissions contributed the major proportion (80%) of GHG emissions per unit of milk, with lesser contributions from cropping (7.6%) and fertilizer application (5.3%). The GHG emissions per 1.0 MMT ECM produced in 2017 were 80.8% of equivalent milk production in 2007. Consequently, although total U.S. ECM production increased by 24.9% between 2007 and 2017, total GHG emissions from this milk production increased by only 1.0%. In line with previous historical analyses, the U.S. dairy industry has made remarkable productivity gains and environmental progress over time. To maintain this culture of continuous improvement, the dairy industry must build on gains made to date and demonstrate its commitment to reducing environmental impacts while improving both economic viability and social acceptability.
美国乳制品行业在 1944 年至 2007 年间显著降低了环境影响,这主要得益于奶牛生产力的提高。然而,尽管过去十年牛奶产量有所增加,但在此期间,整个系统的环境影响分析尚未进行,而环境建模科学在此期间有了很大的进步。本研究的目的是比较 2007 年至 2017 年美国奶牛生产的环境影响。基于奶牛的人口统计学、新陈代谢和营养需求,使用一种确定性模型来估计每生产 1.0×10⁶ 吨(100 万吨或 MMT)能量校正乳(ECM)所需的资源投入、养分排泄和温室气体(GHG)排放量。系统边界从农田投入的制造和运输延伸到农场门口的牛奶。不包括牛奶运输、加工和零售。使用美国奶牛场的典型管理实践、畜群动态和生产数据对奶牛系统进行建模。作物数据来自国家数据库。与 2007 年相比,2017 年生产 1.0 MMT ECM 所需的资源大大减少,2017 年生产系统使用了 2007 年的 74.8%的牛、82.7%的饲料、79.2%的土地和 69.5%的水。废物产出也相应减少,2017 年美国乳制品行业分别产生了 2007 年 79.4%、82.5%和 85.7%的粪便、N 和 P 排泄量。与 2007 年相比,2017 年生产的每 1.0 MMT ECM 排放了 80.9%的 CH4 和 81.5%的 N2O。肠道和粪便排放占每单位牛奶 GHG 排放的主要比例(80%),而作物(7.6%)和肥料施用量(5.3%)的贡献较小。2017 年生产的每 1.0 MMT ECM 的 GHG 排放量为 2007 年等量牛奶产量的 80.8%。因此,尽管 2007 年至 2017 年间美国 ECM 总产量增长了 24.9%,但这一牛奶产量的温室气体总排放量仅增长了 1.0%。与之前的历史分析一致,美国乳制品行业随着时间的推移取得了显著的生产力提高和环境进步。为了保持这种持续改进的文化,乳制品行业必须在现有成果的基础上再接再厉,展示其减少环境影响的承诺,同时提高经济可行性和社会可接受性。