Department of Radiology, Fuwai Hospital, State Key Laboratory of Cardiovascular Disease, National Center for Cardiovascular Diseases, Chinese Academy of Medical Sciences and Peking Union Medical College, Beijing, China.
Department of Radiology, Affiliated Hospital of Guizhou Medical University, Guiyang, China.
Korean J Radiol. 2020 Feb;21(2):210-217. doi: 10.3348/kjr.2019.0557.
We sought to distinguish lipid plaques using a CT quantitative pixel density histogram, based on the pathological diagnosis of lipid cores as the gold standard.
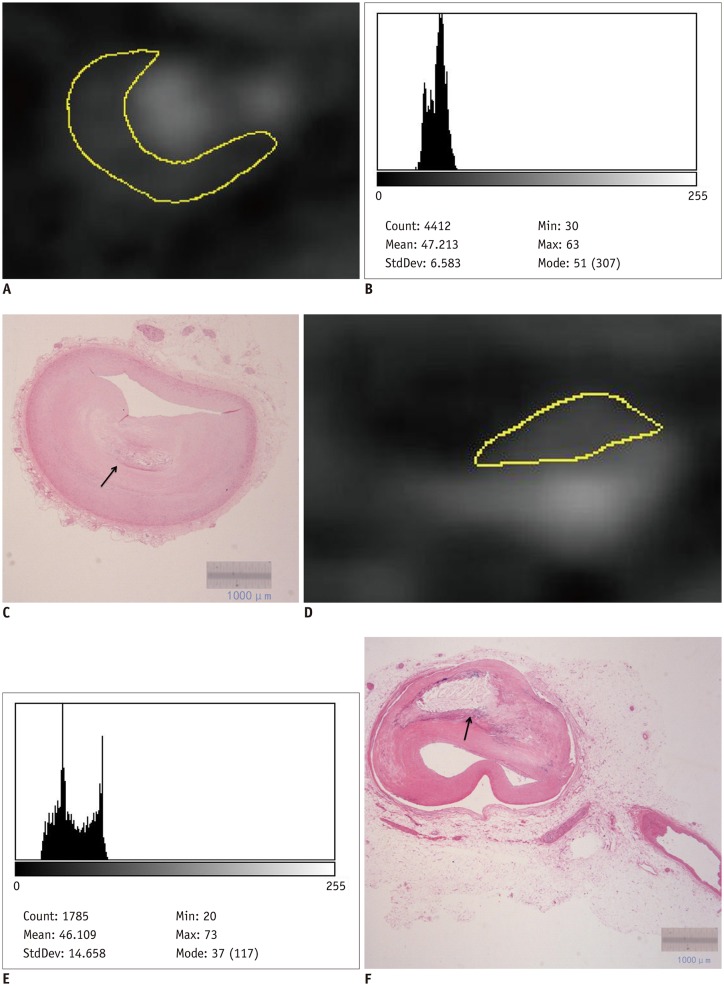
Eight patients awaiting heart transplantation due to end-stage coronary heart disease underwent coronary CT angiography (CCTA) spectroscopy prior to heart transplantation; coronary artery pathological analysis was performed for all patients. Lipid-core plaques were defined pathologically as manifesting a lipid core diameter > 200 μm, a circumference > 60 degrees, and a cap thickness < 450 μm. The percentage distributions of CT pixel attenuation ≤ 20, 30, 40, and 50 HU were calculated using quantitative histogram analysis.
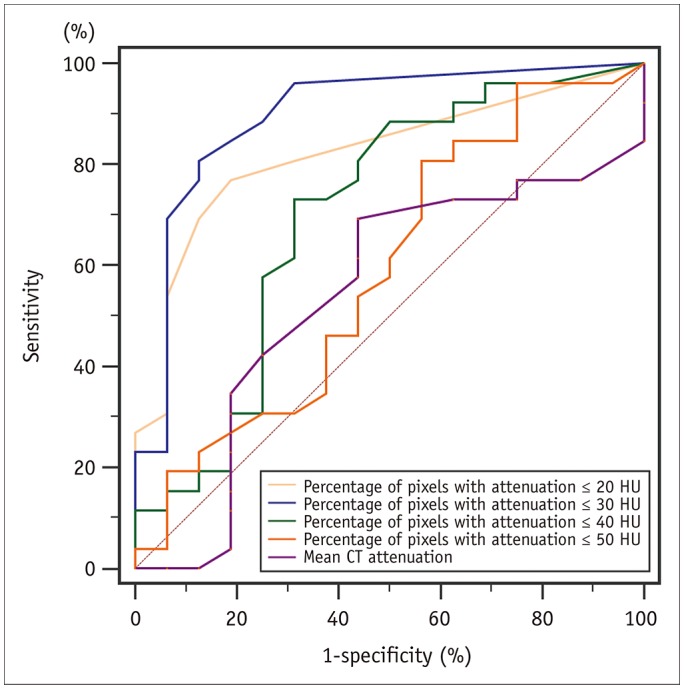
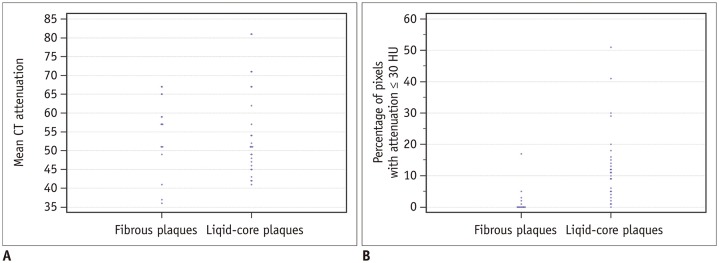
A total of 271 transverse sections were co-registered between CCTA and pathological analysis. Overall, 26 lipid cores and 16 fibrous plaques were identified by pathological analysis. There was no significant difference in median CT attenuation between the lipid and fibrous plaques (51 HU [interquartile range, 46-63] vs. 57 HU [interquartile range, 50-64], = 0.659). The median percentage of CT pixel attenuation ≤ 30 HU accounted for 11% (5-17) of lipid-core plaques and 0% (0-2) of fibrous plaques ( < 0.001). The sensitivity and specificity of the method for diagnosing lipid plaques by the average CT pixel attenuation ≤ 30 HU were 80.8% and 87.5%, respectively. The area under the receiver operator characteristics curve was 0.898 (95% confidence interval: 0.765-0.970; 3.0% was the best cut-off value). The diagnostic performance was significantly higher than those of the average pixel CT attenuation percentages ≤ 20, 40, and 50 HU and the mean CT attenuation ( < 0.05).
In conditions, with the pathological lipid core as the gold standard, quantification of the percentage of average CT pixel attenuation ≤ 30 HU in the histogram can be useful for accurate identification of lipid plaques.
我们试图通过 CT 定量像素密度直方图区分脂质斑块,该方法以脂质核的病理诊断为金标准。
8 例因终末期冠心病等待心脏移植的患者在心脏移植前行冠状动脉 CT 血管造影(CCTA)光谱检查;对所有患者均行冠状动脉病理分析。脂质核斑块的病理定义为脂质核直径>200μm、周长>60°、帽厚度<450μm。采用定量直方图分析计算 CT 像素衰减≤20、30、40 和 50HU 的百分比分布。
共对 CCTA 和病理分析的 271 个横切面进行了配准。总体而言,病理分析共确定了 26 个脂质核和 16 个纤维斑块。脂质斑块和纤维斑块的 CT 平均衰减中位数无显著差异(51HU[四分位间距,46-63] vs.57HU[四分位间距,50-64],=0.659)。CT 像素衰减≤30HU 的中位数百分比占脂质核斑块的 11%(5-17),占纤维斑块的 0%(0-2)(<0.001)。该方法平均 CT 像素衰减≤30HU 诊断脂质斑块的敏感性和特异性分别为 80.8%和 87.5%。受试者工作特征曲线下面积为 0.898(95%置信区间:0.765-0.970;3.0%为最佳截断值)。诊断性能明显高于平均 CT 像素衰减百分比≤20、40 和 50HU 以及平均 CT 衰减(<0.05)。
在本研究条件下,以病理脂质核为金标准,直方图中平均 CT 像素衰减≤30HU 的百分比定量可有助于准确识别脂质斑块。