Metabolic Epidemiology Branch, Division of Cancer Epidemiology and Genetics, National Cancer Institute, National Institutes of Health, Bethesda, Maryland.
Division of Cancer Treatment and Diagnosis, National Cancer Institute, National Institutes of Health, Bethesda, Maryland.
JAMA Netw Open. 2020 Feb 5;3(2):e1921451. doi: 10.1001/jamanetworkopen.2019.21451.
Notable increases in mortality from alcohol-induced causes over the past 2 decades in the United States have been reported. However, comprehensive assessments of trends in alcohol-induced mortality by sex, age, race/ethnicity, and social and geographic factors are lacking.
To examine trends in alcohol-induced mortality rates from 2000 to 2016, comparing results by demographic characteristics including sex, race/ethnicity, age, county-level socioeconomic status, and geographic location.
DESIGN, SETTING, AND PARTICIPANTS: This serial cross-sectional study used US national vital statistics data for years 2000 to 2016 for all US residents older than 15 years. Data analysis was conducted from January to September 2019.
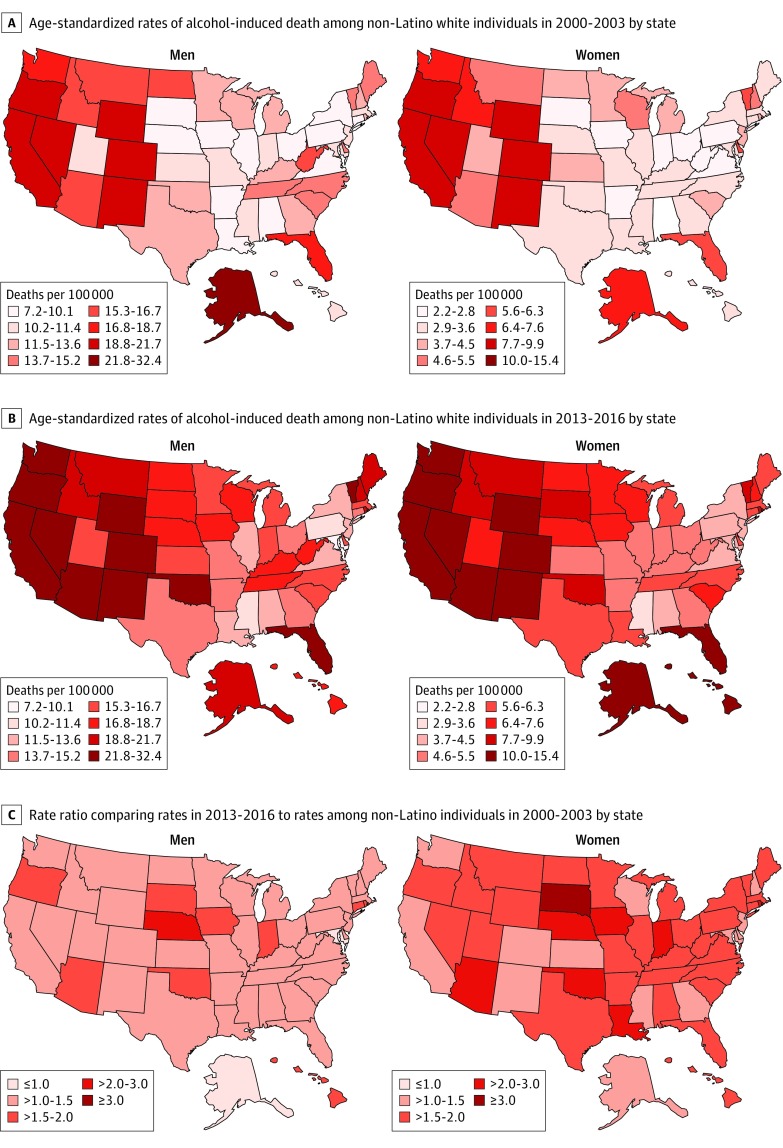
Trends in alcohol-induced mortality by sex, race/ethnicity, age, county-level socioeconomic status (ie, median income, percentage of unemployed residents, percentage of residents with a bachelor's degree), rurality level, and US state.
Alcohol-induced mortality, ie, deaths for which alcohol holds a population-attributable fraction of 1. Deaths were expressed per 100 000 residents as absolute and age-standardized rates. Mortality trends were measured as average annual percentage changes (AAPCs) for the entire period (ie, 2000-2016) and annual percentage changes (APCs) for individual periods of change within the study period.
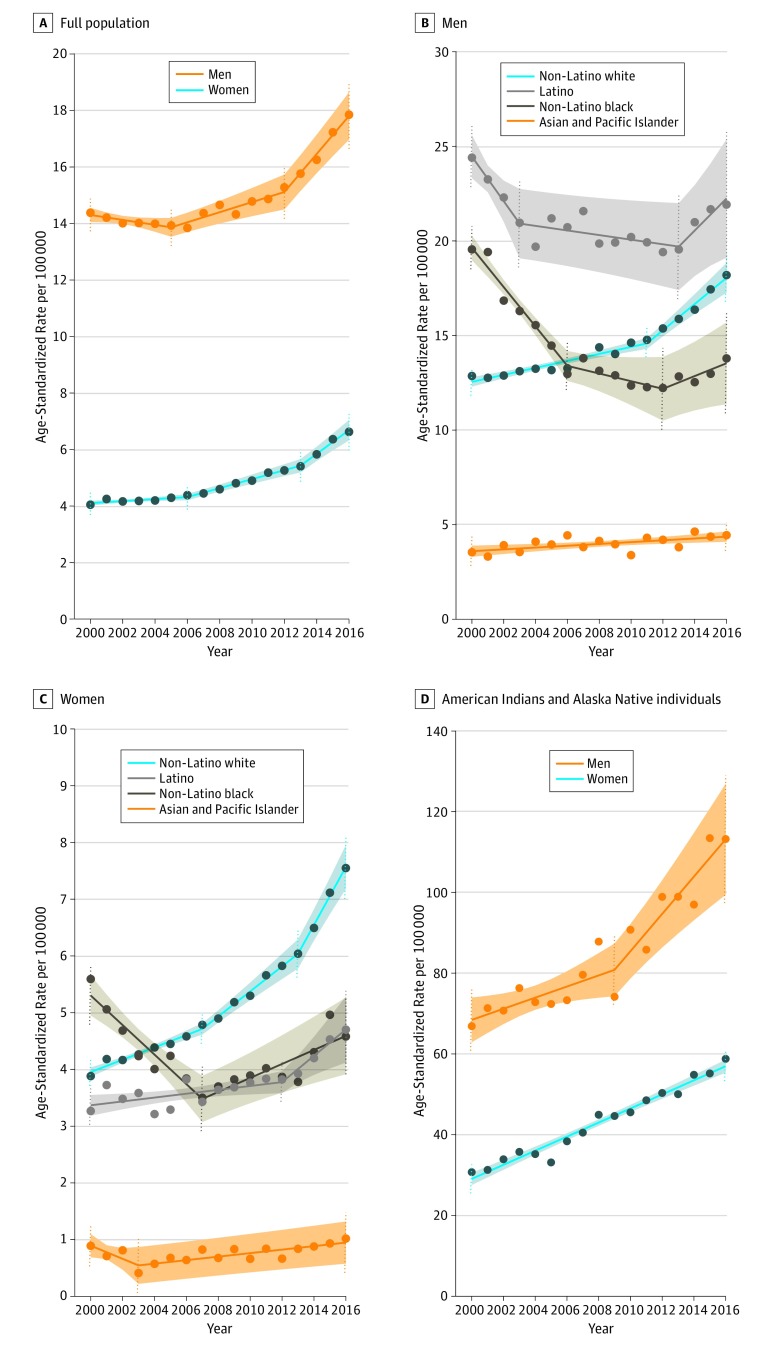
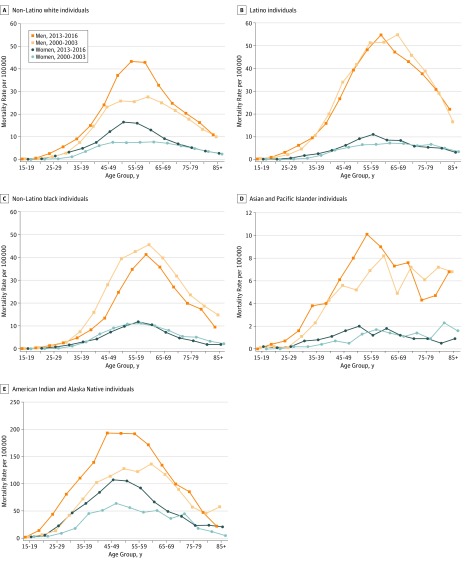
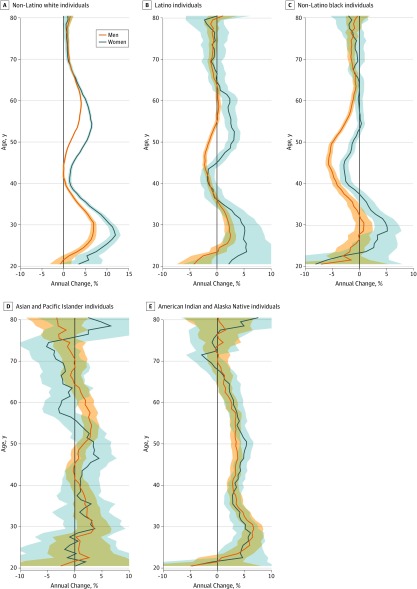
A total of 425 045 alcohol-induced deaths were identified from 2000 to 2016 (2000: 19 627 deaths; 14 979 [76.3%] men; 2016: 34 857 deaths; 25 213 [73.3%] men). The rate of alcohol-induced deaths increased substantially among men (AAPC, 1.4%; 95% CI, 1.0% to 1.8%) and women (AAPC, 3.1%; 95% CI, 2.6% to 3.6%) and accelerated recently (men, 2012-2016: APC, 4.2%; 95% CI, 3.1% to 5.3%; women, 2013-2016: APC, 7.1%; 95% CI, 5.1% to 9.1%). The largest increases by race/ethnicity were observed among American Indian and Alaska Native men (AAPC, 3.3%; 95% CI, 2.6% to 4.0%), American Indian and Alaska Native women (AAPC, 4.2%; 95% CI, 3.8% to 4.6%), and white women (AAPC, 4.1%; 95% CI, 3.6% to 4.7%). Despite initial declines among black women, black men, and Latino men (eg, Latino men, 2000-2003: APC, -5.1%; 95% CI, -9.8% to -0.1%; 2003-2013: APC, -0.6%; 95% CI, -1.4% to 0.2%), increases occurred later in the study period (eg, Latino men, 2013-2016: APC, 4.1%; 95% CI, 0.3% to 8.1%). The rates of increase varied by age group and in turn by racial/ethnic group. Among white individuals, large absolute increases occurred in midlife (eg, men aged 55-59 years, 2000-2003: 25.5 deaths per 100 000 residents; 2013-2016: 43.3 deaths per 100 000 residents; women aged 50-54 years, 2000-2003: 7.4 deaths per 100 000 residents; 2013-2016: 16.5 deaths per 100 000 residents), although APCs were also large for ages 25 to 34 years, ranging from 4.6% to 6.9% per year among men and from 7.3% to 12.0% among women. Among American Indian and Alaska Native individuals, increases throughout the age range were observed, with the largest absolute increase occurring for ages 45 to 49 years among men (2000-2013: 113.6 deaths per 100 000 residents; 2013-2016: 193.1 deaths per 100 000 residents) and for ages 50 to 54 among women (2000-2013: from 56.1 deaths per 100 000 residents; 2013-2016: 105.1 deaths per 100 000 residents).
This study found large increases in alcohol-induced death rates across age and racial/ethnic subgroups of the US population, which have accelerated over recent years. Large increases in alcohol-induced deaths among younger age groups may be associated with future increases in alcohol-related disease.
据报道,在过去的 20 年中,美国因酒精导致的死亡率显著上升。然而,对于性别、年龄、种族/族裔、社会和地理因素等因素导致的酒精性死亡率趋势,目前仍缺乏全面评估。
本研究旨在评估 2000 年至 2016 年期间酒精性死亡率的趋势,并比较不同人口统计学特征(包括性别、种族/族裔、年龄、县一级社会经济地位和地理位置)的结果。
设计、地点和参与者:本研究采用美国全国生命统计数据,对 2000 年至 2016 年所有年龄在 15 岁以上的美国居民进行了一项连续的横断面研究。数据分析于 2019 年 1 月至 9 月进行。
按性别、种族/族裔、年龄、县一级社会经济地位(即中位数收入、失业居民比例、拥有学士学位的居民比例)、农村程度和美国州划分的酒精性死亡率趋势。
酒精性死亡率,即归因于酒精的人口比例为 1 的死亡。以每 10 万居民的绝对和年龄标准化死亡率表示。死亡率趋势通过整个研究期间(即 2000-2016 年)的年平均百分比变化(AAPC)和研究期间各变化期间的年百分比变化(APC)来衡量。
2000 年至 2016 年期间共确定了 425045 例酒精性死亡(2000 年:19627 例死亡;14979 例[76.3%]为男性;2016 年:34857 例死亡;25213 例[73.3%]为男性)。男性(AAPC,1.4%;95%CI,1.0%至 1.8%)和女性(AAPC,3.1%;95%CI,2.6%至 3.6%)的酒精性死亡率均显著上升,且最近加速上升(男性,2012-2016 年:APC,4.2%;95%CI,3.1%至 5.3%;女性,2013-2016 年:APC,7.1%;95%CI,5.1%至 9.1%)。按种族/族裔划分,增幅最大的是美国印第安人和阿拉斯加原住民男性(AAPC,3.3%;95%CI,2.6%至 4.0%)、美国印第安人和阿拉斯加原住民女性(AAPC,4.2%;95%CI,3.8%至 4.6%)和白人女性(AAPC,4.1%;95%CI,3.6%至 4.7%)。尽管黑人女性、黑人男性和拉丁裔男性的死亡率最初有所下降(例如,拉丁裔男性,2000-2003 年:APC,-5.1%;95%CI,-9.8%至-0.1%;2003-2013 年:APC,-0.6%;95%CI,-1.4%至 0.2%),但在研究后期死亡率有所上升(例如,拉丁裔男性,2013-2016 年:APC,4.1%;95%CI,0.3%至 8.1%)。增长率因年龄组而异,继而因种族/族裔群体而异。在白人中,中年时期的绝对增长率较大(例如,男性,55-59 岁年龄组,2000-2003 年:每 10 万居民 25.5 例死亡;2013-2016 年:每 10 万居民 43.3 例死亡;女性,50-54 岁年龄组,2000-2003 年:每 10 万居民 7.4 例死亡;2013-2016 年:每 10 万居民 16.5 例死亡),尽管 25 至 34 岁年龄组的 APC 也很大,范围在男性每年 4.6%至 6.9%和女性每年 7.3%至 12.0%之间。在美国印第安人和阿拉斯加原住民中,观察到整个年龄范围内的增长,其中男性 45 至 49 岁年龄组(2000-2013 年:每 10 万居民 113.6 例死亡;2013-2016 年:每 10 万居民 193.1 例死亡)和女性 50 至 54 岁年龄组(2000-2013 年:每 10 万居民 56.1 例死亡;2013-2016 年:每 10 万居民 105.1 例死亡)的绝对增长率最大。
本研究发现,美国人口的各个年龄和种族/族裔亚组的酒精性死亡率均有大幅上升,且最近呈加速上升趋势。年轻年龄组中因酒精导致的死亡人数增加可能与未来与酒精相关的疾病增加有关。