Nabais Marta F, Lin Tian, Benyamin Beben, Williams Kelly L, Garton Fleur C, Vinkhuyzen Anna A E, Zhang Futao, Vallerga Costanza L, Restuadi Restuadi, Freydenzon Anna, Zwamborn Ramona A J, Hop Paul J, Robinson Matthew R, Gratten Jacob, Visscher Peter M, Hannon Eilis, Mill Jonathan, Brown Matthew A, Laing Nigel G, Mather Karen A, Sachdev Perminder S, Ngo Shyuan T, Steyn Frederik J, Wallace Leanne, Henders Anjali K, Needham Merrilee, Veldink Jan H, Mathers Susan, Nicholson Garth, Rowe Dominic B, Henderson Robert D, McCombe Pamela A, Pamphlett Roger, Yang Jian, Blair Ian P, McRae Allan F, Wray Naomi R
1Institute for Molecular Bioscience, The University of Queensland, Brisbane, QLD 4072 Australia.
2University of Exeter Medical School, Royal Devon & Exeter Hospital, Exeter, Devon EX2 5DW UK.
NPJ Genom Med. 2020 Feb 27;5:10. doi: 10.1038/s41525-020-0118-3. eCollection 2020.
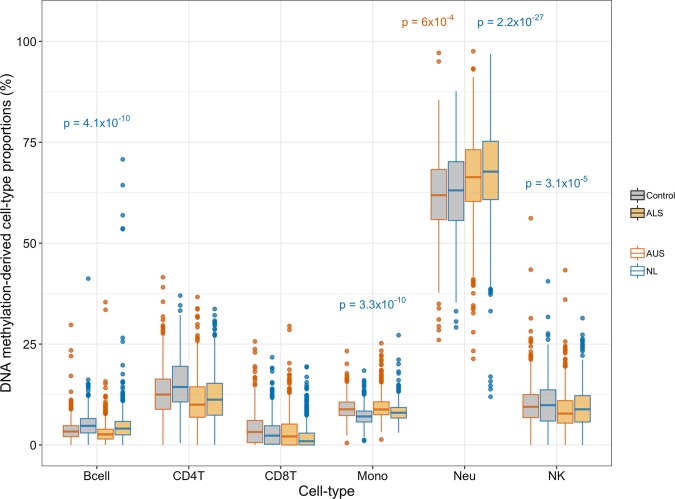
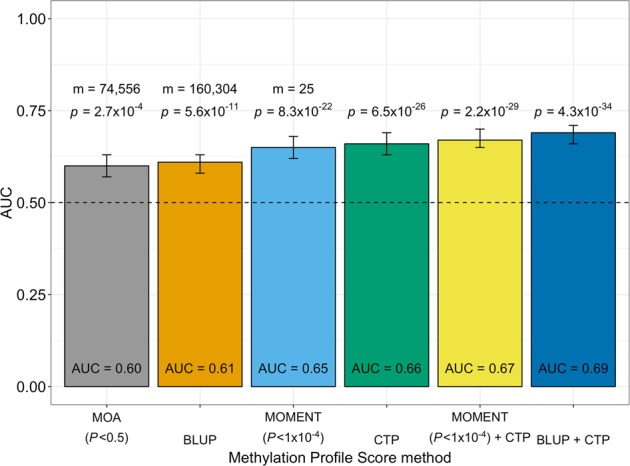
We conducted DNA methylation association analyses using Illumina 450K data from whole blood for an Australian amyotrophic lateral sclerosis (ALS) case-control cohort (782 cases and 613 controls). Analyses used mixed linear models as implemented in the OSCA software. We found a significantly higher proportion of neutrophils in cases compared to controls which replicated in an independent cohort from the Netherlands (1159 cases and 637 controls). The OSCA MOMENT linear mixed model has been shown in simulations to best account for confounders. When combined in a methylation profile score, the 25 most-associated probes identified by MOMENT significantly classified case-control status in the Netherlands sample (area under the curve, AUC = 0.65, CI = [0.62-0.68], = 8.3 × 10). The maximum AUC achieved was 0.69 (CI = [0.66-0.71], = 4.3 × 10) when cell-type proportion was included in the predictor.
我们使用来自澳大利亚肌萎缩侧索硬化症(ALS)病例对照队列(782例病例和613例对照)全血的Illumina 450K数据进行了DNA甲基化关联分析。分析使用了OSCA软件中实现的混合线性模型。我们发现,与对照组相比,病例组中的中性粒细胞比例显著更高,这在来自荷兰的一个独立队列(1159例病例和637例对照)中得到了重复验证。模拟结果表明,OSCA MOMENT线性混合模型最能解释混杂因素。当将其纳入甲基化谱评分时,MOMENT识别出的25个最相关探针在荷兰样本中显著区分了病例对照状态(曲线下面积,AUC = 0.65,CI = [0.62 - 0.68],P = 8.3×10)。当预测因子中纳入细胞类型比例时,达到的最大AUC为0.69(CI = [0.66 - 0.71],P = 4.3×10)。