• 文献检索
  • 文档翻译
  • 深度研究
  • 学术资讯
  • Suppr Zotero 插件Zotero 插件
  • 邀请有礼
  • 套餐&价格
  • 历史记录
应用&插件
Suppr Zotero 插件Zotero 插件浏览器插件Mac 客户端Windows 客户端微信小程序
定价
高级版会员购买积分包购买API积分包
服务
文献检索文档翻译深度研究API 文档MCP 服务
关于我们
关于 Suppr公司介绍联系我们用户协议隐私条款
关注我们

Suppr 超能文献

核心技术专利:CN118964589B侵权必究
粤ICP备2023148730 号-1Suppr @ 2026

文献检索

告别复杂PubMed语法,用中文像聊天一样搜索,搜遍4000万医学文献。AI智能推荐,让科研检索更轻松。

立即免费搜索

文件翻译

保留排版,准确专业,支持PDF/Word/PPT等文件格式,支持 12+语言互译。

免费翻译文档

深度研究

AI帮你快速写综述,25分钟生成高质量综述,智能提取关键信息,辅助科研写作。

立即免费体验

利用地面激光雷达对田间玉米生物量进行无损估计:从地块水平到单叶水平的评估

Non-destructive estimation of field maize biomass using terrestrial lidar: an evaluation from plot level to individual leaf level.

作者信息

Jin Shichao, Su Yanjun, Song Shilin, Xu Kexin, Hu Tianyu, Yang Qiuli, Wu Fangfang, Xu Guangcai, Ma Qin, Guan Hongcan, Pang Shuxin, Li Yumei, Guo Qinghua

机构信息

1State Key Laboratory of Vegetation and Environmental Change, Institute of Botany, Chinese Academy of Sciences, Beijing, 100093 China.

2University of Chinese Academy of Sciences, No. 19A Yuquan Road, Beijing, 100049 China.

出版信息

Plant Methods. 2020 May 13;16:69. doi: 10.1186/s13007-020-00613-5. eCollection 2020.

DOI:10.1186/s13007-020-00613-5
PMID:32435271
原文链接:https://pmc.ncbi.nlm.nih.gov/articles/PMC7222476/
Abstract

BACKGROUND

Precision agriculture is an emerging research field that relies on monitoring and managing field variability in phenotypic traits. An important phenotypic trait is biomass, a comprehensive indicator that can reflect crop yields. However, non-destructive biomass estimation at fine levels is unknown and challenging due to the lack of accurate and high-throughput phenotypic data and algorithms.

RESULTS

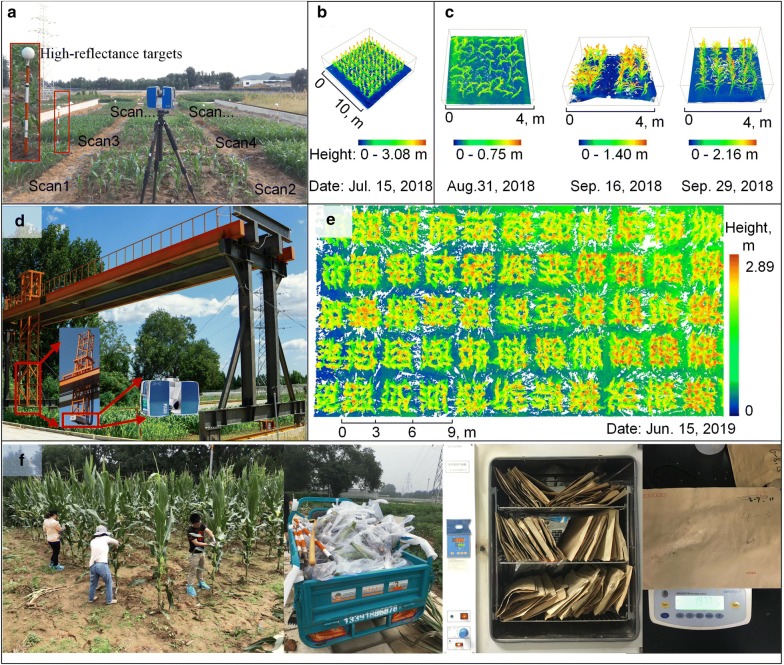
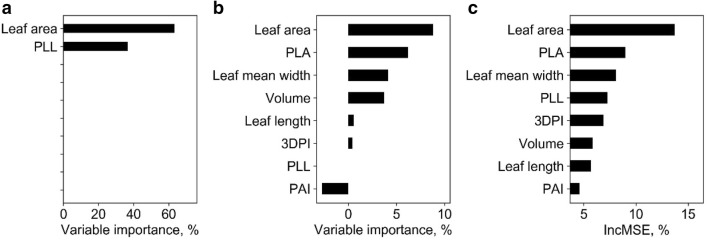
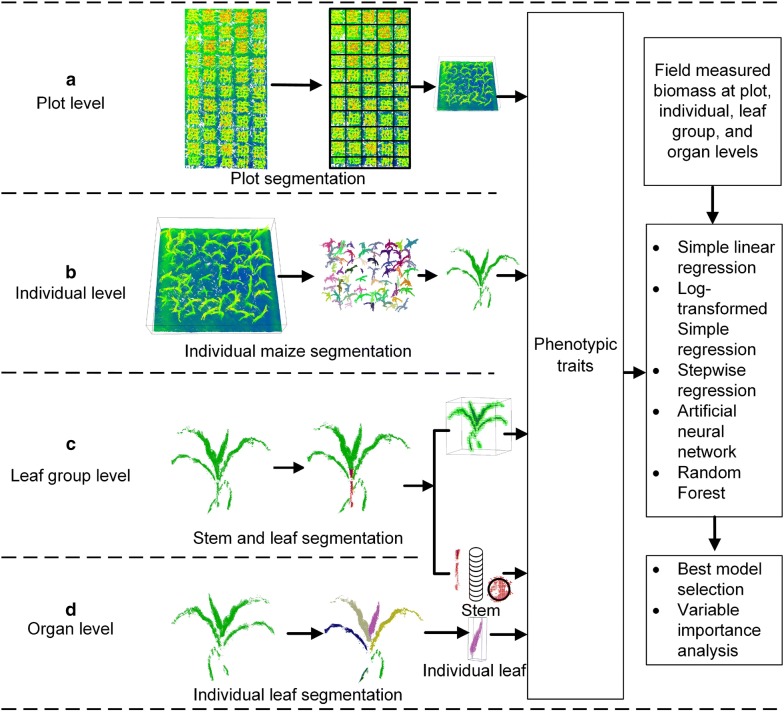
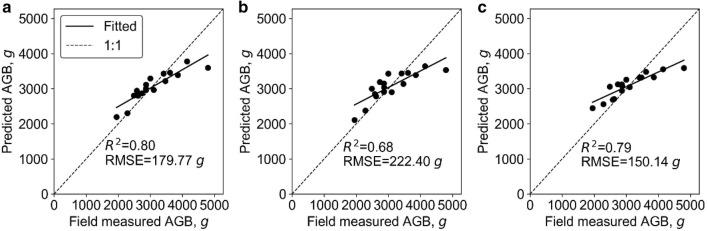
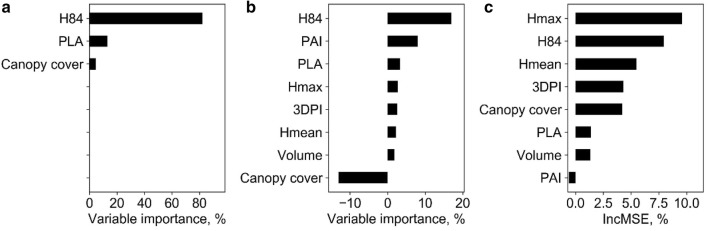
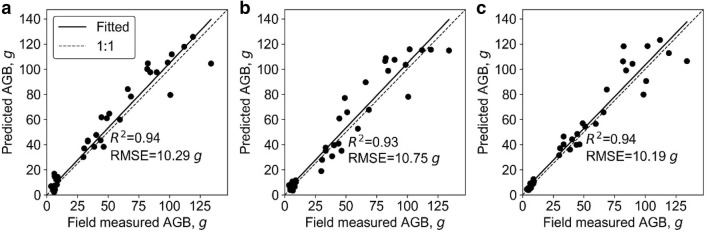
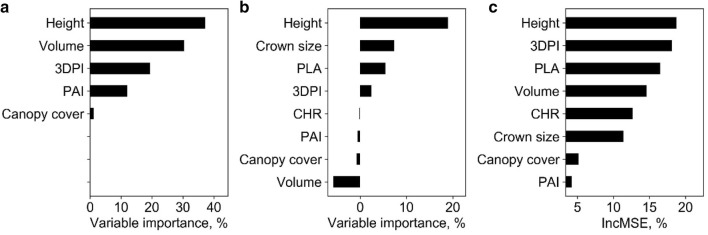
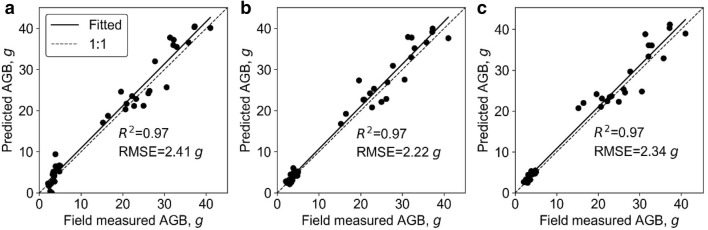
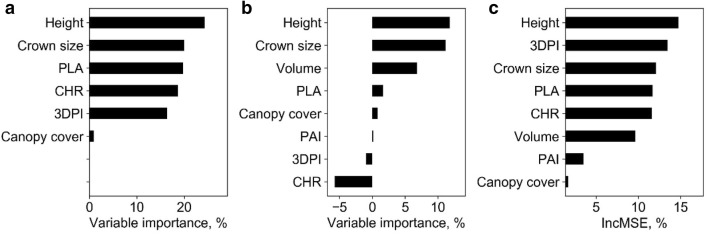
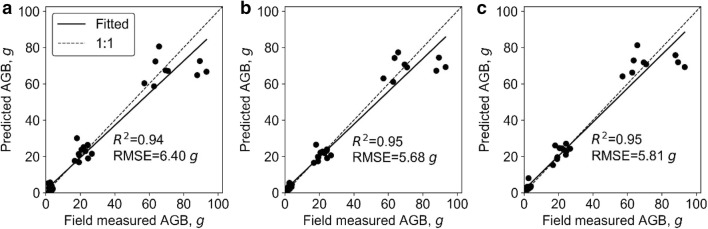
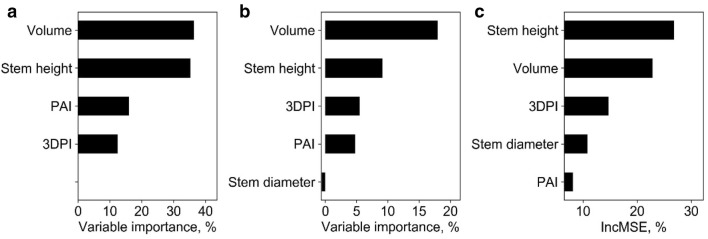
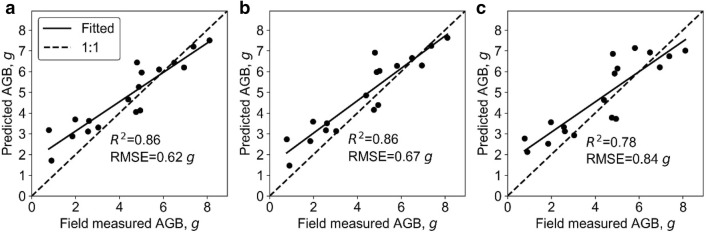
In this study, we evaluated the capability of terrestrial light detection and ranging (lidar) data in estimating field maize biomass at the plot, individual plant, leaf group, and individual organ (i.e., individual leaf or stem) levels. The terrestrial lidar data of 59 maize plots with more than 1000 maize plants were collected and used to calculate phenotypes through a deep learning-based pipeline, which were then used to predict maize biomass through simple regression (SR), stepwise multiple regression (SMR), artificial neural network (ANN), and random forest (RF). The results showed that terrestrial lidar data were useful for estimating maize biomass at all levels (at each level, R was greater than 0.80), and biomass estimation at leaf group level was the most precise (R = 0.97, RMSE = 2.22 g) among all four levels. All four regression techniques performed similarly at all levels. However, considering the transferability and interpretability of the model itself, SR is the suggested method for estimating maize biomass from terrestrial lidar-derived phenotypes. Moreover, height-related variables showed to be the most important and robust variables for predicting maize biomass from terrestrial lidar at all levels, and some two-dimensional variables (e.g., leaf area) and three-dimensional variables (e.g., volume) showed great potential as well.

CONCLUSION

We believe that this study is a unique effort on evaluating the capability of terrestrial lidar on estimating maize biomass at difference levels, and can provide a useful resource for the selection of the phenotypes and models required to estimate maize biomass in precision agriculture practices.

摘要

背景

精准农业是一个新兴的研究领域,它依赖于对表型性状的田间变异性进行监测和管理。生物量是一个重要的表型性状,是能够反映作物产量的综合指标。然而,由于缺乏准确且高通量的表型数据和算法,在精细水平上进行无损生物量估计尚不清楚且具有挑战性。

结果

在本研究中,我们评估了地面激光雷达数据在估计田间玉米生物量方面的能力,评估水平包括小区、单株、叶组和单个器官(即单片叶子或茎)水平。我们收集了59个玉米小区中1000多株玉米的地面激光雷达数据,并通过基于深度学习的流程来计算表型,然后通过简单回归(SR)、逐步多元回归(SMR)、人工神经网络(ANN)和随机森林(RF)来预测玉米生物量。结果表明,地面激光雷达数据在所有水平上都可用于估计玉米生物量(在每个水平上,R均大于0.80),并且在所有四个水平中,叶组水平的生物量估计最为精确(R = 0.97,RMSE = 2.22 g)。所有四种回归技术在各个水平上的表现相似。然而,考虑到模型本身的可转移性和可解释性,SR是从地面激光雷达衍生的表型估计玉米生物量的推荐方法。此外,与高度相关的变量在所有水平上都是从地面激光雷达预测玉米生物量最重要且最可靠的变量,一些二维变量(如叶面积)和三维变量(如体积)也显示出很大的潜力。

结论

我们认为,本研究是评估地面激光雷达在不同水平上估计玉米生物量能力的一项独特工作,可为精准农业实践中估计玉米生物量所需的表型和模型选择提供有用资源。

https://cdn.ncbi.nlm.nih.gov/pmc/blobs/fec2/7222476/0bf75a2b6d6c/13007_2020_613_Fig12_HTML.jpg
https://cdn.ncbi.nlm.nih.gov/pmc/blobs/fec2/7222476/8eed2bb60395/13007_2020_613_Fig1_HTML.jpg
https://cdn.ncbi.nlm.nih.gov/pmc/blobs/fec2/7222476/3b1b6989bba0/13007_2020_613_Fig2_HTML.jpg
https://cdn.ncbi.nlm.nih.gov/pmc/blobs/fec2/7222476/2e9cf330387b/13007_2020_613_Fig3_HTML.jpg
https://cdn.ncbi.nlm.nih.gov/pmc/blobs/fec2/7222476/b060e0784176/13007_2020_613_Fig4_HTML.jpg
https://cdn.ncbi.nlm.nih.gov/pmc/blobs/fec2/7222476/e2af301e40cb/13007_2020_613_Fig5_HTML.jpg
https://cdn.ncbi.nlm.nih.gov/pmc/blobs/fec2/7222476/2ca9379cbabf/13007_2020_613_Fig6_HTML.jpg
https://cdn.ncbi.nlm.nih.gov/pmc/blobs/fec2/7222476/c9d65fcfa99b/13007_2020_613_Fig7_HTML.jpg
https://cdn.ncbi.nlm.nih.gov/pmc/blobs/fec2/7222476/062cad315bf5/13007_2020_613_Fig8_HTML.jpg
https://cdn.ncbi.nlm.nih.gov/pmc/blobs/fec2/7222476/069bb6f217d7/13007_2020_613_Fig9_HTML.jpg
https://cdn.ncbi.nlm.nih.gov/pmc/blobs/fec2/7222476/4e416c3ebef5/13007_2020_613_Fig10_HTML.jpg
https://cdn.ncbi.nlm.nih.gov/pmc/blobs/fec2/7222476/26e22ef856b4/13007_2020_613_Fig11_HTML.jpg
https://cdn.ncbi.nlm.nih.gov/pmc/blobs/fec2/7222476/0bf75a2b6d6c/13007_2020_613_Fig12_HTML.jpg

相似文献

1
Non-destructive estimation of field maize biomass using terrestrial lidar: an evaluation from plot level to individual leaf level.利用地面激光雷达对田间玉米生物量进行无损估计:从地块水平到单叶水平的评估
Plant Methods. 2020 May 13;16:69. doi: 10.1186/s13007-020-00613-5. eCollection 2020.
2
Deep Learning: Individual Maize Segmentation From Terrestrial Lidar Data Using Faster R-CNN and Regional Growth Algorithms.深度学习:使用更快的区域卷积神经网络(Faster R-CNN)和区域生长算法从地面激光雷达数据中进行单个玉米分割
Front Plant Sci. 2018 Jun 22;9:866. doi: 10.3389/fpls.2018.00866. eCollection 2018.
3
Evaluating maize phenotype dynamics under drought stress using terrestrial lidar.利用地面激光雷达评估干旱胁迫下玉米的表型动态。
Plant Methods. 2019 Feb 4;15:11. doi: 10.1186/s13007-019-0396-x. eCollection 2019.
4
Estimation of maize above-ground biomass based on stem-leaf separation strategy integrated with LiDAR and optical remote sensing data.基于激光雷达和光学遥感数据集成的茎叶分离策略估算玉米地上生物量
PeerJ. 2019 Sep 17;7:e7593. doi: 10.7717/peerj.7593. eCollection 2019.
5
[Estimating individual tree aboveground biomass of the mid-subtropical forest using airborne LiDAR technology].[利用机载激光雷达技术估算中亚热带森林单木地上生物量]
Ying Yong Sheng Tai Xue Bao. 2014 Nov;25(11):3229-36.
6
Research on Estimating Rice Canopy Height and LAI Based on LiDAR Data.基于 LiDAR 数据的水稻冠层高度和叶面积指数估算研究。
Sensors (Basel). 2023 Oct 9;23(19):8334. doi: 10.3390/s23198334.
7
Total and component forest aboveground biomass inversion via LiDAR-derived features and machine learning algorithms.基于激光雷达衍生特征和机器学习算法的森林地上生物量总量及组分反演
Front Plant Sci. 2023 Oct 26;14:1258521. doi: 10.3389/fpls.2023.1258521. eCollection 2023.
8
UAV Multisensory Data Fusion and Multi-Task Deep Learning for High-Throughput Maize Phenotyping.UAV 多源数据融合与多任务深度学习在高通量玉米表型分析中的应用。
Sensors (Basel). 2023 Feb 6;23(4):1827. doi: 10.3390/s23041827.
9
Estimation of the fraction of absorbed photosynthetically active radiation (fPAR) in maize canopies using LiDAR data and hyperspectral imagery.利用激光雷达数据和高光谱图像估算玉米冠层吸收的光合有效辐射(fPAR)份额。
PLoS One. 2018 May 29;13(5):e0197510. doi: 10.1371/journal.pone.0197510. eCollection 2018.
10
Estimating Biomass and Canopy Height With LiDAR for Field Crop Breeding.利用激光雷达估算大田作物育种的生物量和冠层高度
Front Plant Sci. 2019 Sep 26;10:1145. doi: 10.3389/fpls.2019.01145. eCollection 2019.

引用本文的文献

1
Nitrogen monitoring and inversion algorithms of fruit trees based on spectral remote sensing: a deep review.基于光谱遥感的果树氮素监测与反演算法:深度综述
Front Plant Sci. 2024 Nov 22;15:1489151. doi: 10.3389/fpls.2024.1489151. eCollection 2024.
2
A Comprehensive Review of LiDAR Applications in Crop Management for Precision Agriculture.激光雷达在精准农业作物管理中的应用综述
Sensors (Basel). 2024 Aug 21;24(16):5409. doi: 10.3390/s24165409.
3
3D Morphological Feature Quantification and Analysis of Corn Leaves.玉米叶片的三维形态特征量化与分析

本文引用的文献

1
Improving the efficiency of soybean breeding with high-throughput canopy phenotyping.利用高通量冠层表型分析提高大豆育种效率
Plant Methods. 2019 Nov 19;15:139. doi: 10.1186/s13007-019-0519-4. eCollection 2019.
2
Estimating Biomass and Canopy Height With LiDAR for Field Crop Breeding.利用激光雷达估算大田作物育种的生物量和冠层高度
Front Plant Sci. 2019 Sep 26;10:1145. doi: 10.3389/fpls.2019.01145. eCollection 2019.
3
Evaluating maize phenotype dynamics under drought stress using terrestrial lidar.利用地面激光雷达评估干旱胁迫下玉米的表型动态。
Plant Phenomics. 2024 Aug 6;6:0225. doi: 10.34133/plantphenomics.0225. eCollection 2024.
4
SCAG: A Stratified, Clustered, and Growing-Based Algorithm for Soybean Branch Angle Extraction and Ideal Plant Architecture Evaluation.SCAG:一种用于大豆分枝角度提取和理想株型评估的分层、聚类和基于生长的算法。
Plant Phenomics. 2024 Jul 23;6:0190. doi: 10.34133/plantphenomics.0190. eCollection 2024.
5
The Importance of Using Realistic 3D Canopy Models to Calculate Light Interception in the Field.使用逼真的三维冠层模型计算田间光截获量的重要性。
Plant Phenomics. 2023 Aug 18;5:0082. doi: 10.34133/plantphenomics.0082. eCollection 2023.
6
Field-measured canopy height may not be as accurate and heritable as believed: evidence from advanced 3D sensing.实地测量的冠层高度可能不像人们认为的那样准确且具有遗传性:来自先进三维传感技术的证据。
Plant Methods. 2023 Apr 2;19(1):39. doi: 10.1186/s13007-023-01012-2.
7
Applications of LiDAR in Agriculture and Future Research Directions.激光雷达在农业中的应用及未来研究方向。
J Imaging. 2023 Feb 24;9(3):57. doi: 10.3390/jimaging9030057.
8
Enhancing crop yields through improvements in the efficiency of photosynthesis and respiration.通过提高光合作用和呼吸作用的效率来提高作物产量。
New Phytol. 2023 Jan;237(1):60-77. doi: 10.1111/nph.18545. Epub 2022 Nov 17.
9
Estimation of Greenhouse Lettuce Growth Indices Based on a Two-Stage CNN Using RGB-D Images.基于 RGB-D 图像的两阶段卷积神经网络的温室生菜生长指标估算。
Sensors (Basel). 2022 Jul 23;22(15):5499. doi: 10.3390/s22155499.
10
Proximal and remote sensing in plant phenomics: 20 years of progress, challenges, and perspectives.植物表型组学中的近远程感应:20 年的进展、挑战与展望。
Plant Commun. 2022 Nov 14;3(6):100344. doi: 10.1016/j.xplc.2022.100344. Epub 2022 Jun 2.
Plant Methods. 2019 Feb 4;15:11. doi: 10.1186/s13007-019-0396-x. eCollection 2019.
4
Deep Learning: Individual Maize Segmentation From Terrestrial Lidar Data Using Faster R-CNN and Regional Growth Algorithms.深度学习:使用更快的区域卷积神经网络(Faster R-CNN)和区域生长算法从地面激光雷达数据中进行单个玉米分割
Front Plant Sci. 2018 Jun 22;9:866. doi: 10.3389/fpls.2018.00866. eCollection 2018.
5
High Throughput Determination of Plant Height, Ground Cover, and Above-Ground Biomass in Wheat with LiDAR.利用激光雷达高通量测定小麦株高、地面覆盖度和地上生物量
Front Plant Sci. 2018 Feb 27;9:237. doi: 10.3389/fpls.2018.00237. eCollection 2018.
6
Crop 3D-a LiDAR based platform for 3D high-throughput crop phenotyping.作物 3D - 基于 LiDAR 的高通量作物表型 3D 平台。
Sci China Life Sci. 2018 Mar;61(3):328-339. doi: 10.1007/s11427-017-9056-0. Epub 2017 Dec 6.
7
Modeling Aboveground Biomass in Hulunber Grassland Ecosystem by Using Unmanned Aerial Vehicle Discrete Lidar.利用无人机离散激光雷达对呼伦贝尔草原生态系统地上生物量进行建模
Sensors (Basel). 2017 Jan 19;17(1):180. doi: 10.3390/s17010180.
8
Food security: Close crop yield gap.粮食安全:缩小作物产量差距。
Nature. 2011 Nov 30;480(7375):39. doi: 10.1038/480039e.
9
Food security: crop species diversity.粮食安全:作物物种多样性
Science. 2010 Apr 9;328(5975):169-70. doi: 10.1126/science.328.5975.169-e.
10
3D lidar imaging for detecting and understanding plant responses and canopy structure.用于检测和理解植物反应及冠层结构的三维激光雷达成像
J Exp Bot. 2007;58(4):881-98. doi: 10.1093/jxb/erl142. Epub 2006 Oct 9.