Department of Medical Oncology, Dana-Farber Cancer Institute, Boston, MA 02215, USA.
Cancer Program, Broad Institute of Harvard and MIT, Cambridge, 02142 MA, USA.
Bioinformatics. 2020 Aug 1;36(15):4348-4349. doi: 10.1093/bioinformatics/btaa554.
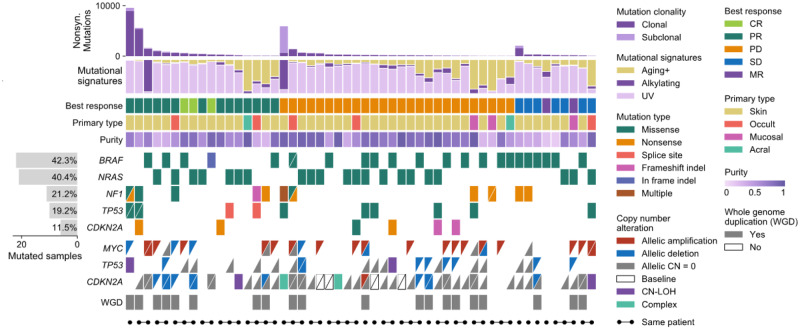
Large-scale sequencing studies have created a need to succinctly visualize genomic characteristics of patient cohorts linked to widely variable phenotypic information. This is often done by visualizing the co-occurrence of variants with comutation plots. Current tools lack the ability to create highly customizable and publication quality comutation plots from arbitrary user data.
We developed CoMut, a stand-alone, object-oriented Python package that creates comutation plots from arbitrary input data, including categorical data, continuous data, bar graphs, side bar graphs and data that describes relationships between samples.
The CoMut package is open source and is available at https://github.com/vanallenlab/comut under the MIT License, along with documentation and examples. A no installation, easy-to-use implementation is available on Google Colab (see GitHub).
大规模测序研究需要简洁地可视化与广泛变化的表型信息相关联的患者队列的基因组特征。这通常通过可视化变异与共突变图的共现来完成。当前的工具缺乏从任意用户数据创建高度可定制和出版质量共突变图的能力。
我们开发了 CoMut,这是一个独立的、面向对象的 Python 包,它可以从任意输入数据创建共突变图,包括分类数据、连续数据、柱状图、侧边柱状图和描述样本之间关系的数据。
CoMut 包是开源的,并可在 MIT 许可证下在 https://github.com/vanallenlab/comut 获得,同时还提供文档和示例。在 Google Colab 上也提供了一个无需安装、易于使用的实现(请参见 GitHub)。