Department of Pharmacy Practice and Science, College of Pharmacy, University of Arizona, Tucson, AZ, USA.
Department of Medicine, Division of Rheumatology, College of Medicine, University of Arizona, Tucson, AZ, USA.
Addiction. 2021 Apr;116(4):819-830. doi: 10.1111/add.15189. Epub 2020 Aug 19.
Little is known about opioid and gabapentinoid (OPI-GABA) use duration and dose patterns' associations with adverse outcome risks. We examined associations between OPI-GABA dose and duration trajectories and subsequent drug overdose.
Retrospective cohort study.
US Medicare.
Using a 5% sample (2011-16), we identified 71 005 fee-for-service Medicare beneficiaries with fibromyalgia, low back pain, neuropathy and/or osteoarthritis initiating OPIs and/or GABAs [mean age ± standard deviation (SD) = 65.5 ± 14.5 years, female = 68.1%, white = 76.8%].
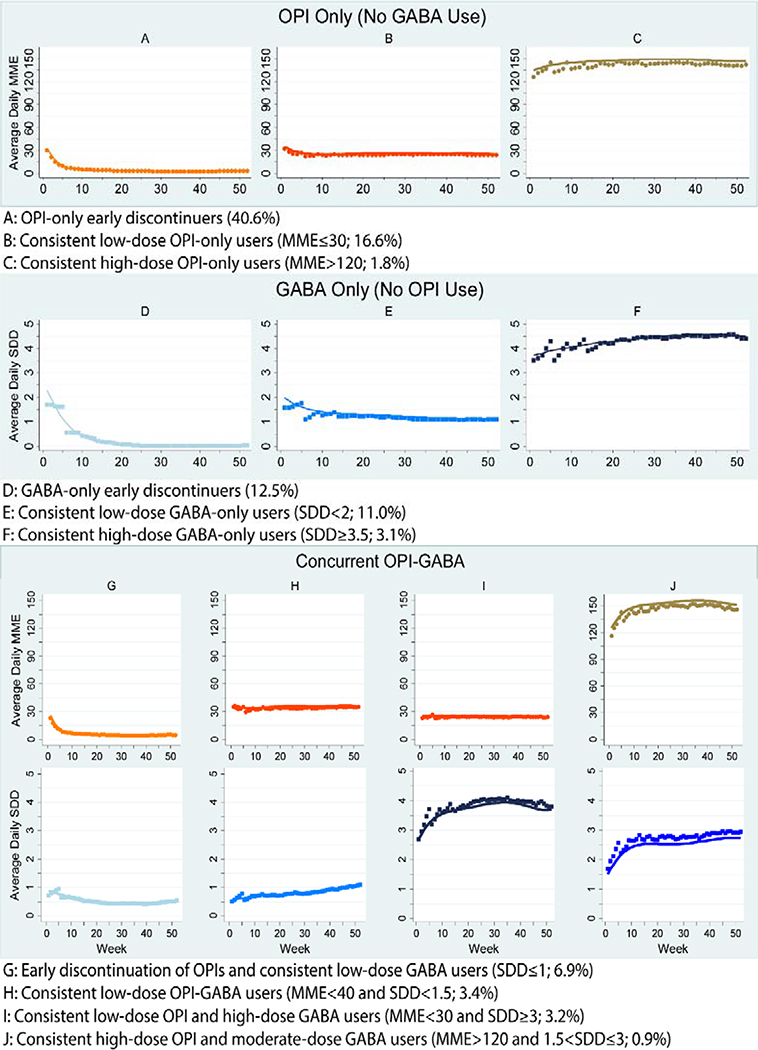
Group-based multi-trajectory models identified distinct OPI-GABA use patterns during the year of OPI and/or GABA initiation, based on weekly average standardized daily dose (i.e. OPIs = morphine milligram equivalent, GABAs = minimum effective daily dose). We estimated models with three to 12 trajectories and selected the best model based on Bayesian information criterion (BIC) and Nagin's criteria. We estimated risk of time to first drug overdose diagnosis within 12 months following the index year, adjusting for socio-demographic and health factors using inverse probability of treatment weighted multivariable Cox proportional hazards models.
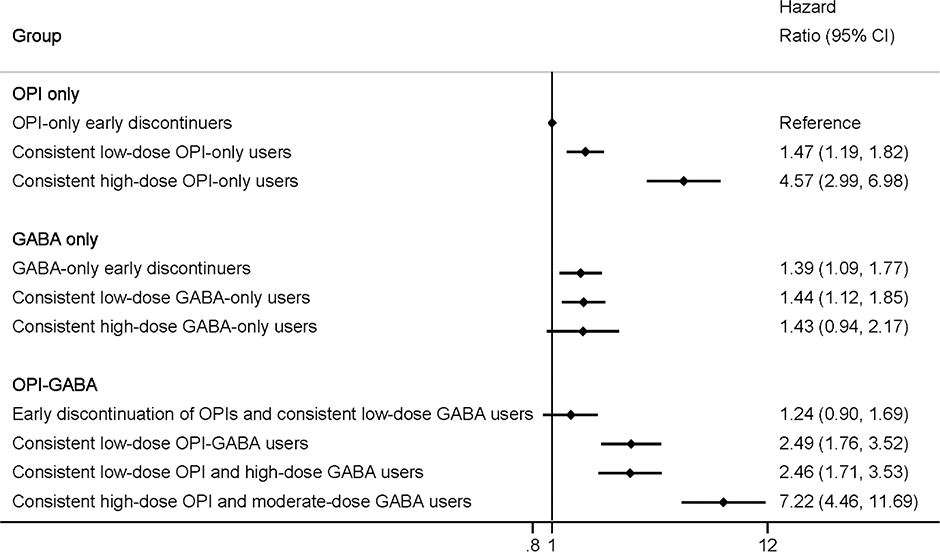
We identified 10 distinct trajectories (BIC = -1 176 954; OPI-only = 3, GABA-only = 3, OPI-GABA = 4). Compared with OPI-only early discontinuers (40.6% of the cohort), 1-year drug overdose risk varied by trajectory group: consistent low-dose OPI-only users [16.6%; hazard ratio (HR) = 1.47, 95% confidence interval (CI) = 1.19-1.82], consistent high-dose OPI-only users (1.8%; HR = 4.57, 95% CI = 2.99-6.98), GABA-only early discontinuers (12.5%; HR = 1.39, 95% CI = 1.09-1.77), consistent low-dose GABA-only users (11.0%; HR = 1.44, 95% CI = 1.12-1.85), consistent high-dose GABA-only users (3.1%; HR = 1.43, 95% CI = 0.94-2.17), early discontinuation of OPIs and consistent low-dose GABA users (6.9%; HR = 1.24, 95% CI = 0.90-1.69), consistent low-dose OPI-GABA users (3.4%; HR = 2.49, 95% CI = 1.76-3.52), consistent low-dose OPI and high-dose GABA users (3.2%; HR = 2.46, 95% CI = 1.71-3.53) and consistent high-dose OPI and moderate-dose GABA users (0.9%; HR = 7.22, 95% CI = 4.46-11.69).
Risk of drug overdose varied substantially among US Medicare beneficiaries on different use trajectories of opioids and gabapentinoids. High-dose opioid-only users and all consistent opioid and gabapentinoid users (regardless of doses) had more than double the risk of subsequent drug overdose compared with opioid-only early discontinuers.
关于阿片类药物和加巴喷丁类药物(OPI-GABA)使用持续时间和剂量模式与不良结局风险之间的关联,我们知之甚少。我们研究了 OPI-GABA 剂量和持续时间轨迹与随后药物过量之间的关联。
回顾性队列研究。
美国医疗保险。
使用 5%的样本(2011-16 年),我们确定了 71005 名接受纤维肌痛、腰痛、神经病和/或骨关节炎治疗的医疗保险受益人,他们开始使用阿片类药物和/或 GABA(平均年龄±标准差[SD]=65.5±14.5 岁,女性=68.1%,白人=76.8%)。
基于 OPI 和/或 GABA 起始年度每周平均标准化日剂量(即阿片类药物=吗啡毫克当量,GABAs=最小有效日剂量),基于组的多轨迹模型确定了 OPI-GABA 使用模式的不同轨迹。我们估计了具有三到 12 个轨迹的模型,并根据贝叶斯信息准则(BIC)和 Nagin 标准选择了最佳模型。我们使用逆概率治疗加权多变量 Cox 比例风险模型,调整了社会人口统计学和健康因素,估计了索引年后 12 个月内首次药物过量诊断的时间风险。
我们确定了 10 个不同的轨迹(BIC=-1176954;OPI 仅=3,GABA 仅=3,OPI-GABA=4)。与 OPI 仅早期停药者(队列的 40.6%)相比,1 年药物过量风险因轨迹组而异:持续低剂量 OPI 仅使用者[16.6%;危险比(HR)=1.47,95%置信区间(CI)=1.19-1.82],持续高剂量 OPI 仅使用者(1.8%;HR=4.57,95%CI=2.99-6.98),GABA 仅早期停药者(12.5%;HR=1.39,95%CI=1.09-1.77),持续低剂量 GABA 仅使用者(11.0%;HR=1.44,95%CI=1.12-1.85),持续高剂量 GABA 仅使用者(3.1%;HR=1.43,95%CI=0.94-2.17),OPI 和持续低剂量 GABA 早期停药者(6.9%;HR=1.24,95%CI=0.90-1.69),持续低剂量 OPI-GABA 使用者(3.4%;HR=2.49,95%CI=1.76-3.52),持续低剂量 OPI 和高剂量 GABA 使用者(3.2%;HR=2.46,95%CI=1.71-3.53)和持续高剂量 OPI 和中等剂量 GABA 使用者(0.9%;HR=7.22,95%CI=4.46-11.69)。
美国医疗保险受益人阿片类药物和加巴喷丁类药物使用轨迹不同,药物过量风险差异很大。与 OPI 仅早期停药者相比,高剂量 OPI 仅使用者和所有持续使用阿片类药物和加巴喷丁类药物(无论剂量如何)的患者随后发生药物过量的风险增加了一倍以上。