Department of Epidemiology, Mailman School of Public Health, Columbia University, New York, New York, USA.
School of Social and Family Dynamics, Arizona State University, Tempe, Arizona, USA.
Int J Methods Psychiatr Res. 2020 Dec;29(4):1-9. doi: 10.1002/mpr.1842. Epub 2020 Jul 13.
Survey nonresponse has increased across decades, making the amount of attrition a focus in generating inferences from longitudinal data. Use of inverse probability weights [IPWs] and other statistical approaches are common, but residual bias remains a threat. Quantitative bias analysis for nonrandom attrition as an adjunct to IPW may yield more robust inference.
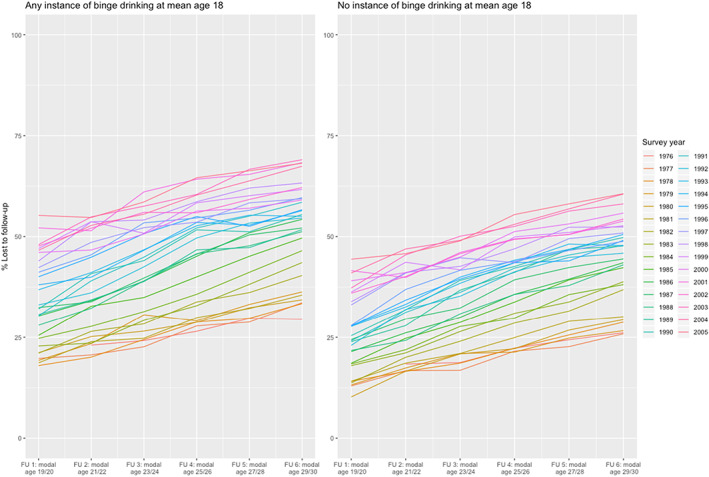
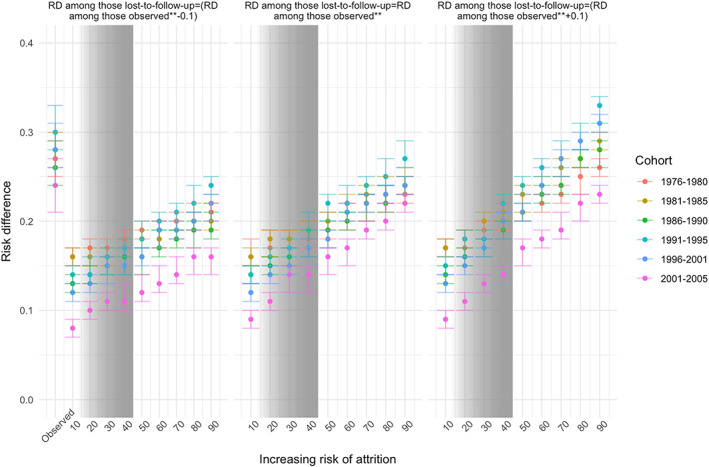
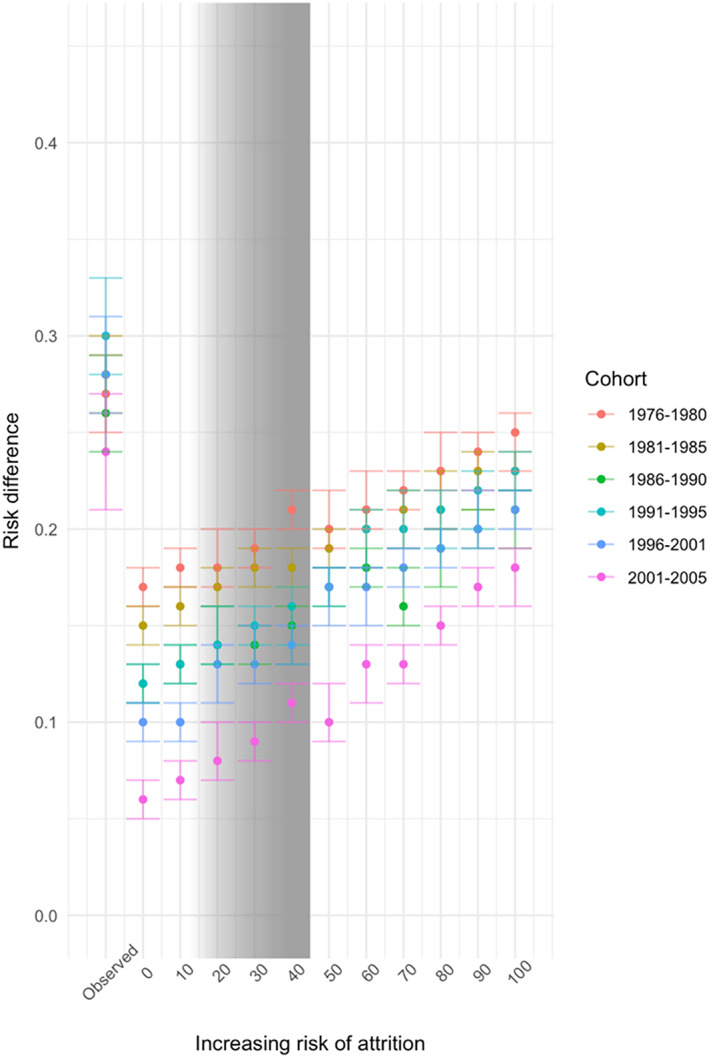
Data were drawn from the Monitoring the Future panel studies [twelfth grade, base-year: 1976-2005; age 29/30 follow-up: 1987-2017, N = 73,298]. We then applied IPW imputation in increasing percentages, assuming varying risk differences [RDs] among nonresponders. Measurements included past-two-week binge drinking at base-year and every follow-up. Demographic and other correlates of binge drinking contributed to IPW estimation.
Attrition increased: 31.14%, base-year 1976; 61.33%, base-year 2005. The magnitude of bias depended not on attrition rate but on prevalence of binge drinking and RD among nonrespondents. The probable range of binge drinking among nonresponders was 12-45%. In every scenario, base-year and follow-up binge drinking were associated. The likely range of true RDs was 0.14 [95% CI: 0.11-0.17] to 0.28 [95% CI: 0.25-0.31].
When attrition is present, the amount of attrition alone is insufficient to understand contribution to effect estimates. We recommend including bias analysis in longitudinal analyses.
几十年来,调查的无回应率不断增加,使得人员流失量成为从纵向数据中得出推论的焦点。使用逆概率权重(Inverse Probability Weights,简称 IPW)和其他统计方法是常见的,但残余偏差仍然是一个威胁。作为 IPW 的辅助手段,对非随机流失进行定量偏差分析可能会产生更稳健的推论。
数据来自监测未来小组研究[十二年级,基础年份:1976-2005;29/30 岁随访:1987-2017,N=73298]。然后,我们假设无回应者之间存在不同的风险差异(Risk Differences,简称 RD),按递增百分比应用 IPW 插补。测量包括基础年份和每个随访时过去两周的狂欢饮酒。狂欢饮酒的人口统计学和其他相关因素有助于 IPW 的估计。
流失率增加:基础年份 1976 年为 31.14%;基础年份 2005 年为 61.33%。偏差的大小不仅取决于流失率,还取决于无回应者的狂欢饮酒流行率和 RD。无回应者狂欢饮酒的可能范围为 12-45%。在每种情况下,基础年份和随访时的狂欢饮酒都存在关联。真正 RD 的可能范围为 0.14[95%置信区间:0.11-0.17]至 0.28[95%置信区间:0.25-0.31]。
当存在流失时,仅流失量本身不足以了解对效应估计的贡献。我们建议在纵向分析中包括偏差分析。