Kanankege Kaushi S T, Alvarez Julio, Zhang Lin, Perez Andres M
Department of Veterinary Population Medicine, College of Veterinary Medicine, University of Minnesota, Saint Paul, MN, United States.
Departamento de Sanidad Animal, Centro de Vigilancia Sanitaria Veterinaria (VISAVET), Facultad de Veterinaria, Universidad Complutense, Madrid, Spain.
Front Vet Sci. 2020 Jul 7;7:339. doi: 10.3389/fvets.2020.00339. eCollection 2020.
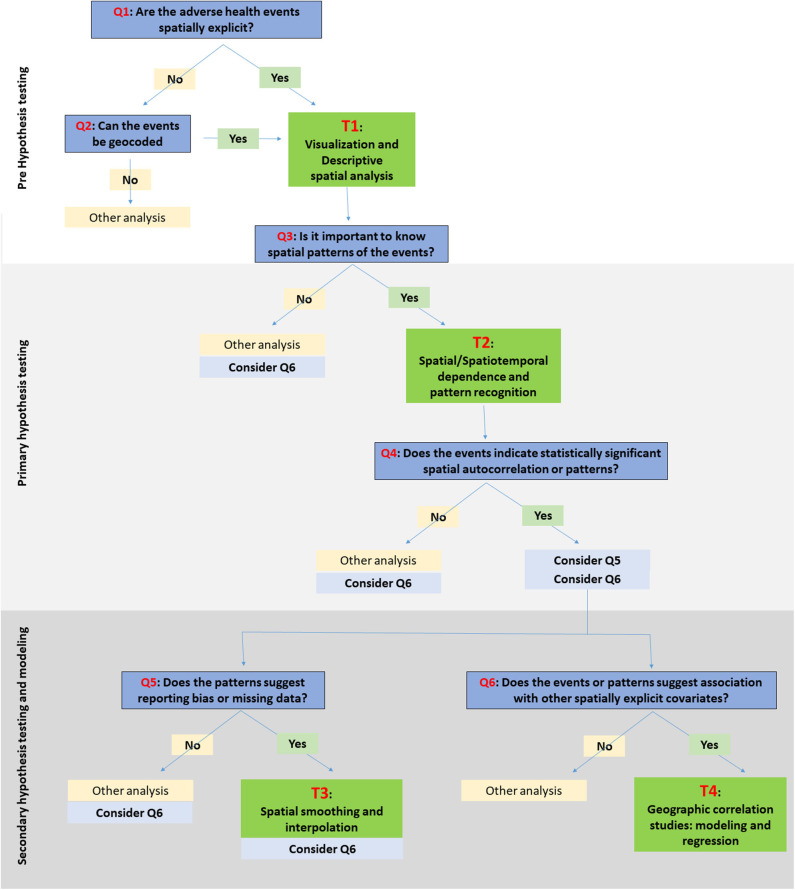
Spatiotemporal visualization and analytical tools (SATs) are increasingly being applied to risk-based surveillance/monitoring of adverse health events affecting humans, animals, and ecosystems. Different disciplines use diverse SATs to address similar research questions. The juxtaposition of these diverse techniques provides a list of options for researchers who are new to population-level spatial eco-epidemiology. Here, we are conducting a narrative review to provide an overview of the multiple available SATs, and introducing a framework for choosing among them when addressing common research questions across disciplines. The framework is comprised of three stages: (a) pre-hypothesis testing stage, in which hypotheses regarding the spatial dependence of events are generated; (b) primary hypothesis testing stage, in which the existence of spatial dependence and patterns are tested; and (c) secondary-hypothesis testing and spatial modeling stage, in which predictions and inferences were made based on the identified spatial dependences and associated covariates. In this step-wise process, six key research questions are formulated, and the answers to those questions should lead researchers to select one or more methods from four broad categories of SATs: (T1) visualization and descriptive analysis; (T2) spatial/spatiotemporal dependence and pattern recognition; (T3) spatial smoothing and interpolation; and (T4) geographic correlation studies (i.e., spatial modeling and regression). The SATs described here include both those used for decades and also other relatively new tools. Through this framework review, we intend to facilitate the choice among available SATs and promote their interdisciplinary use to support improving human, animal, and ecosystem health.
时空可视化与分析工具(SATs)正越来越多地应用于基于风险的对影响人类、动物和生态系统的不良健康事件的监测。不同学科使用不同的SATs来解决相似的研究问题。这些不同技术的并列,为刚接触人群层面空间生态流行病学的研究人员提供了一系列选择。在此,我们进行一项叙述性综述,以概述多种可用的SATs,并介绍一个在跨学科解决常见研究问题时在它们之间进行选择的框架。该框架由三个阶段组成:(a)假设前测试阶段,在此阶段生成关于事件空间依赖性的假设;(b)主要假设测试阶段,在此阶段测试空间依赖性和模式的存在;以及(c)次要假设测试和空间建模阶段,在此阶段基于已识别的空间依赖性和相关协变量进行预测和推断。在这个逐步过程中,制定了六个关键研究问题,对这些问题的回答应引导研究人员从四类广泛的SATs中选择一种或多种方法:(T1)可视化和描述性分析;(T2)空间/时空依赖性和模式识别;(T3)空间平滑和插值;以及(T4)地理相关性研究(即空间建模和回归)。这里描述的SATs既包括已经使用了几十年的工具,也包括其他相对较新的工具。通过这个框架综述,我们旨在促进在可用的SATs之间进行选择,并促进它们的跨学科使用,以支持改善人类、动物和生态系统健康。