UPDUB, ISREC Department, School of Life Sciences (SV), EPFL, 1015 Lausanne, Switzerland.
Bioinformatics Group, Max Planck Institute of Immunobiology and Epigenetics, 79108 Freiburg, Germany.
Bioinformatics. 2021 Apr 20;37(3):422-423. doi: 10.1093/bioinformatics/btaa692.
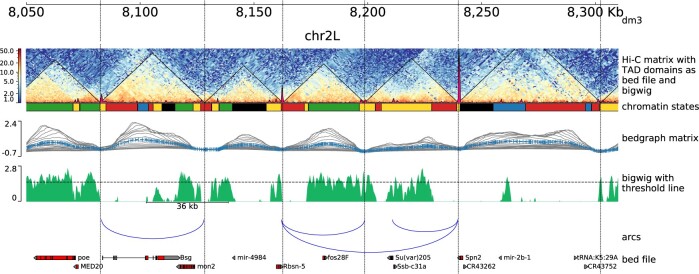
Generating publication ready plots to display multiple genomic tracks can pose a serious challenge. Making desirable and accurate figures requires considerable effort. This is usually done by hand or using a vector graphic software.
pyGenomeTracks (PGT) is a modular plotting tool that easily combines multiple tracks. It enables a reproducible and standardized generation of highly customizable and publication ready images.
PGT is available through a graphical interface on https://usegalaxy.eu and through the command line. It is provided on conda via the bioconda channel, on pip and it is openly developed on github: https://github.com/deeptools/pyGenomeTracks.
Supplementary data are available at Bioinformatics online.
生成可用于发表的图形以展示多个基因组轨迹可能是一个严峻的挑战。要制作出理想且精确的图形需要付出大量的努力。这通常是通过手工或使用矢量图形软件来完成的。
pyGenomeTracks(PGT)是一个模块化的绘图工具,可以轻松组合多个轨迹。它可以实现可重复且标准化的高定制化和可发表图像的生成。
PGT 可通过 https://usegalaxy.eu 上的图形界面以及命令行使用。它通过 conda 的 bioconda 通道、pip 以及 github(https://github.com/deeptools/pyGenomeTracks)上的公开开发提供。
补充数据可在 Bioinformatics 在线获得。