Department of Disease Control, London School of Hygiene and Tropical Medicine, London, UK.
Kenya Medical Research Institute-Wellcome Trust Research Programme, P.O. Box 43640-00100, Nairobi, Kenya.
Malar J. 2020 Oct 2;19(1):353. doi: 10.1186/s12936-020-03425-z.
Declining malaria prevalence and pressure on external funding have increased the need for efficiency in malaria control in sub-Saharan Africa (SSA). Modelled Plasmodium falciparum parasite rate (PfPR) maps are increasingly becoming available and provide information on the epidemiological situation of countries. However, how these maps are understood or used for national malaria planning is rarely explored. In this study, the practices and perceptions of national decision-makers on the utility of malaria risk maps, showing prevalence of parasitaemia or incidence of illness, was investigated.
A document review of recent National Malaria Strategic Plans was combined with 64 in-depth interviews with stakeholders in Kenya, Malawi and the Democratic Republic of Congo (DRC). The document review focused on the type of epidemiological maps included and their use in prioritising and targeting interventions. Interviews (14 Kenya, 17 Malawi, 27 DRC, 6 global level) explored drivers of stakeholder perceptions of the utility, value and limitations of malaria risk maps.
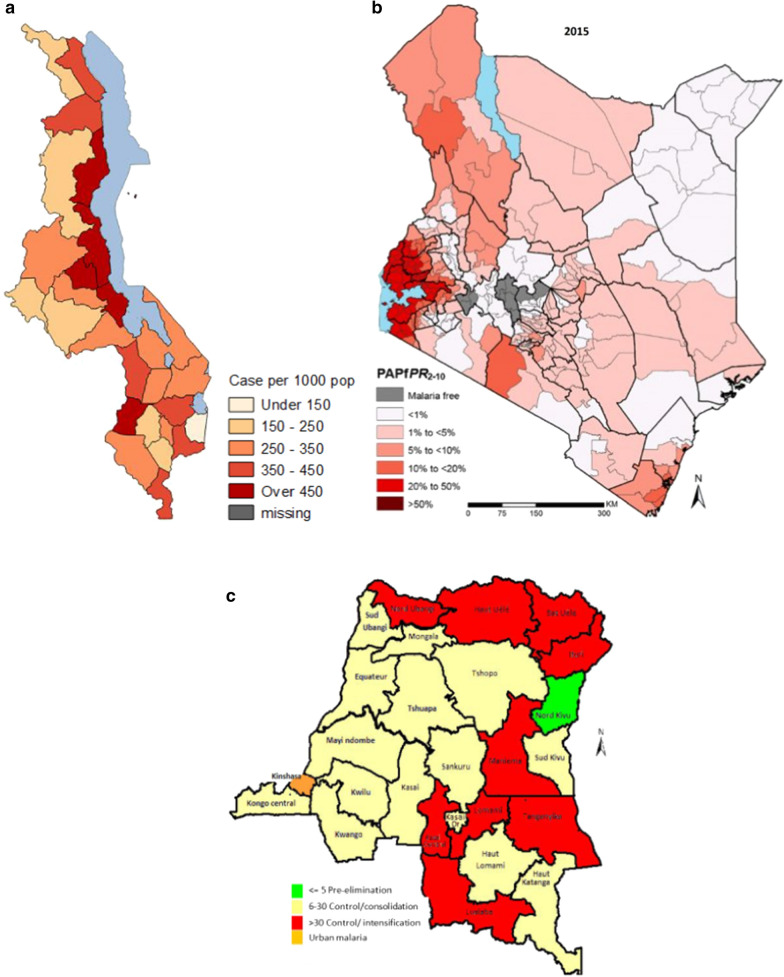
Three different types of maps were used to show malaria epidemiological strata: malaria prevalence using a PfPR modelled map (Kenya); malaria incidence using routine health system data (Malawi); and malaria prevalence using data from the most recent Demographic and Health Survey (DRC). In Kenya the map was used to target preventative interventions, including long-lasting insecticide-treated nets (LLINs) and intermittent preventive treatment in pregnancy (IPTp), whilst in Malawi and DRC the maps were used to target in-door residual spraying (IRS) and LLINs distributions in schools. Maps were also used for operational planning, supply quantification, financial justification and advocacy. Findings from the interviews suggested that decision-makers lacked trust in the modelled PfPR maps when based on only a few empirical data points (Malawi and DRC).
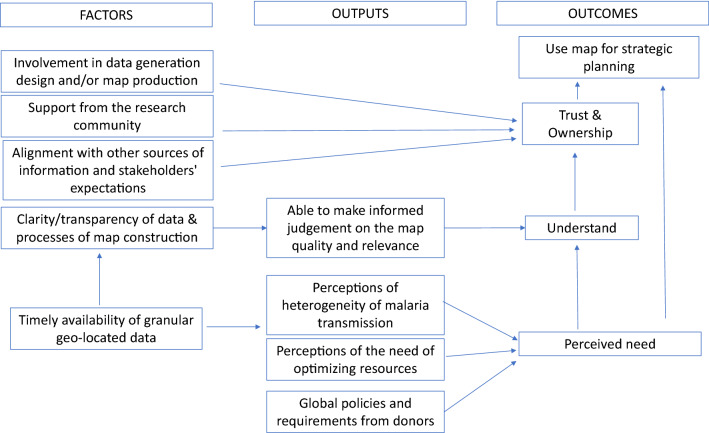
Maps were generally used to identify areas with high prevalence in order to implement specific interventions. Despite the availability of national level modelled PfPR maps in all three countries, they were only used in one country. Perceived utility of malaria risk maps was associated with the epidemiological structure of the country and use was driven by perceived need, understanding (quality and relevance), ownership and trust in the data used to develop the maps.
在撒哈拉以南非洲(SSA),疟疾流行率下降和外部资金压力增加,这使得疟疾控制需要提高效率。建模的恶性疟原虫寄生虫率(PfPR)图越来越多地可用,并提供了关于国家流行病学情况的信息。然而,这些地图是如何被理解或用于国家疟疾规划的,却很少被探讨。在这项研究中,我们调查了国家决策者对疟疾风险地图(显示寄生虫血症流行率或疾病发病率)的实用性的看法和认知。
我们对最近的国家疟疾战略计划的文件进行了审查,并结合了对肯尼亚、马拉维和刚果民主共和国(DRC)利益攸关方的 64 次深入访谈。文件审查重点关注纳入的流行病学地图类型及其在确定干预措施优先次序和目标方面的应用。访谈(肯尼亚 14 次、马拉维 17 次、DRC 27 次、全球 6 次)探讨了利益攸关方对疟疾风险地图实用性、价值和局限性的看法的驱动因素。
为了显示疟疾流行病学分层,使用了三种不同类型的地图:使用建模 PfPR 地图显示疟疾流行率(肯尼亚);使用常规卫生系统数据显示疟疾发病率(马拉维);以及使用最近的人口与健康调查数据显示疟疾流行率(DRC)。在肯尼亚,该地图用于针对预防性干预措施,包括长效驱虫蚊帐(LLINs)和孕期间歇性预防治疗(IPTp),而在马拉维和 DRC,该地图用于针对室内残留喷洒(IRS)和学校 LLINs 分布。地图还用于业务规划、供应量化、财务证明和宣传。访谈结果表明,决策者对基于少数经验数据点的建模 PfPR 地图缺乏信任(马拉维和 DRC)。
地图通常用于识别高流行率地区,以便实施特定干预措施。尽管在所有三个国家都有国家一级的建模 PfPR 地图,但只有一个国家在使用。疟疾风险地图的实用性与国家的流行病学结构有关,使用取决于对地图所使用数据的需求、理解(质量和相关性)、所有权和信任。