• 文献检索
  • 文档翻译
  • 深度研究
  • 学术资讯
  • Suppr Zotero 插件Zotero 插件
  • 邀请有礼
  • 套餐&价格
  • 历史记录
应用&插件
Suppr Zotero 插件Zotero 插件浏览器插件Mac 客户端Windows 客户端微信小程序
定价
高级版会员购买积分包购买API积分包
服务
文献检索文档翻译深度研究API 文档MCP 服务
关于我们
关于 Suppr公司介绍联系我们用户协议隐私条款
关注我们

Suppr 超能文献

核心技术专利:CN118964589B侵权必究
粤ICP备2023148730 号-1Suppr @ 2026

文献检索

告别复杂PubMed语法,用中文像聊天一样搜索,搜遍4000万医学文献。AI智能推荐,让科研检索更轻松。

立即免费搜索

文件翻译

保留排版,准确专业,支持PDF/Word/PPT等文件格式,支持 12+语言互译。

免费翻译文档

深度研究

AI帮你快速写综述,25分钟生成高质量综述,智能提取关键信息,辅助科研写作。

立即免费体验

各国新冠病毒感染情况的小组预测。

Panel forecasts of country-level Covid-19 infections.

作者信息

Liu Laura, Moon Hyungsik Roger, Schorfheide Frank

机构信息

Indiana University, United States of America.

University of Southern California, United States of America.

出版信息

J Econom. 2021 Jan;220(1):2-22. doi: 10.1016/j.jeconom.2020.08.010. Epub 2020 Oct 16.

DOI:10.1016/j.jeconom.2020.08.010
PMID:33100475
原文链接:https://pmc.ncbi.nlm.nih.gov/articles/PMC7566698/
Abstract

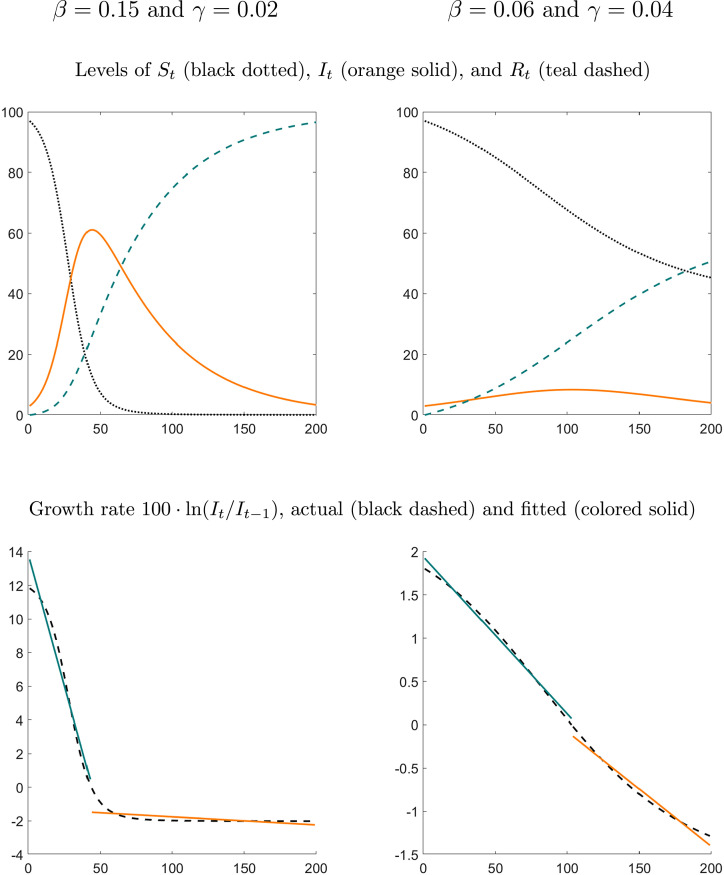
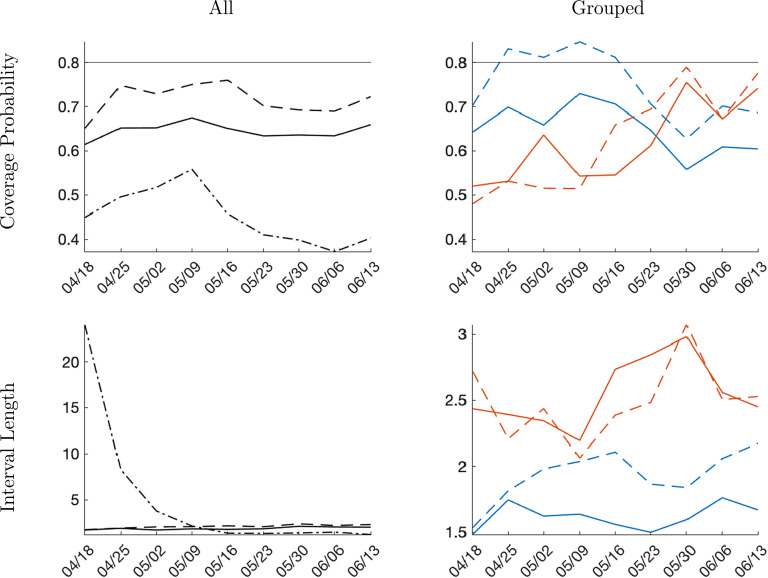
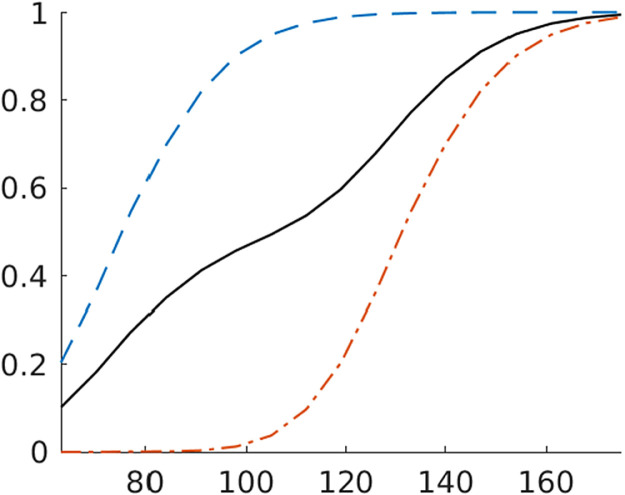
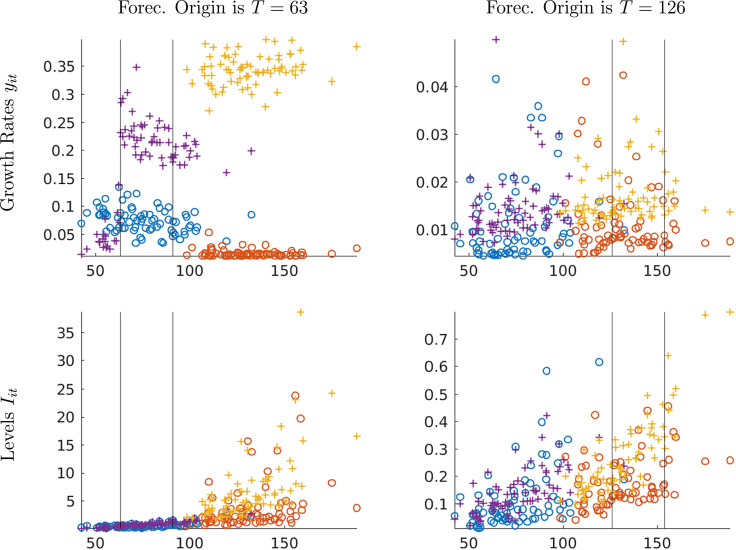
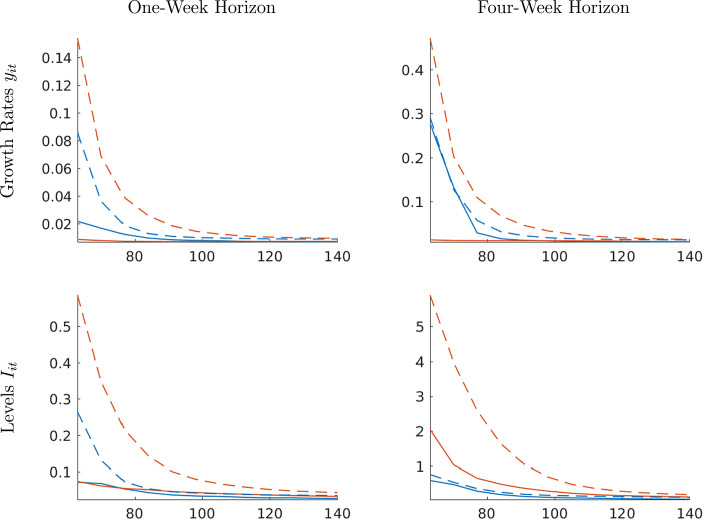
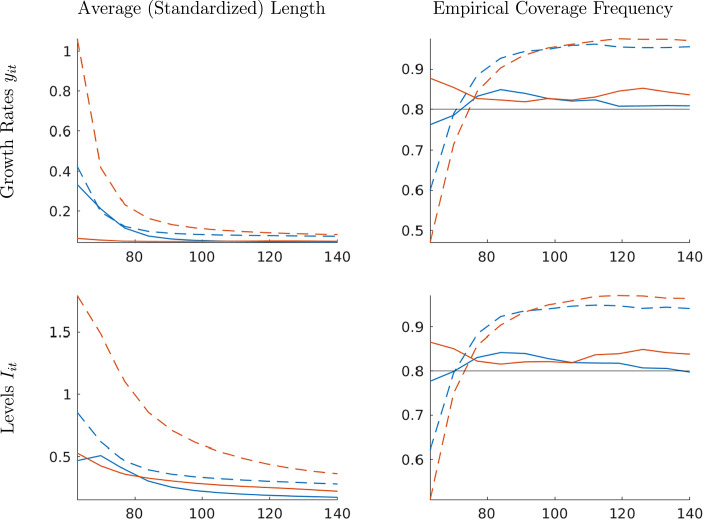
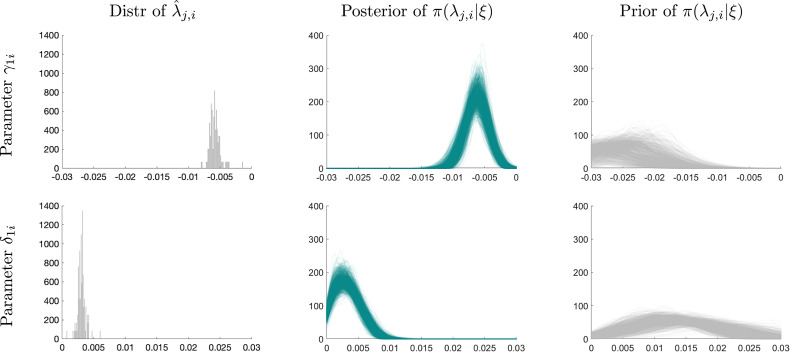
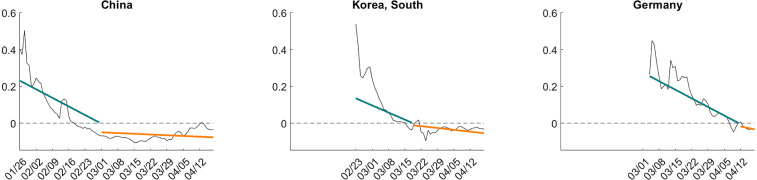
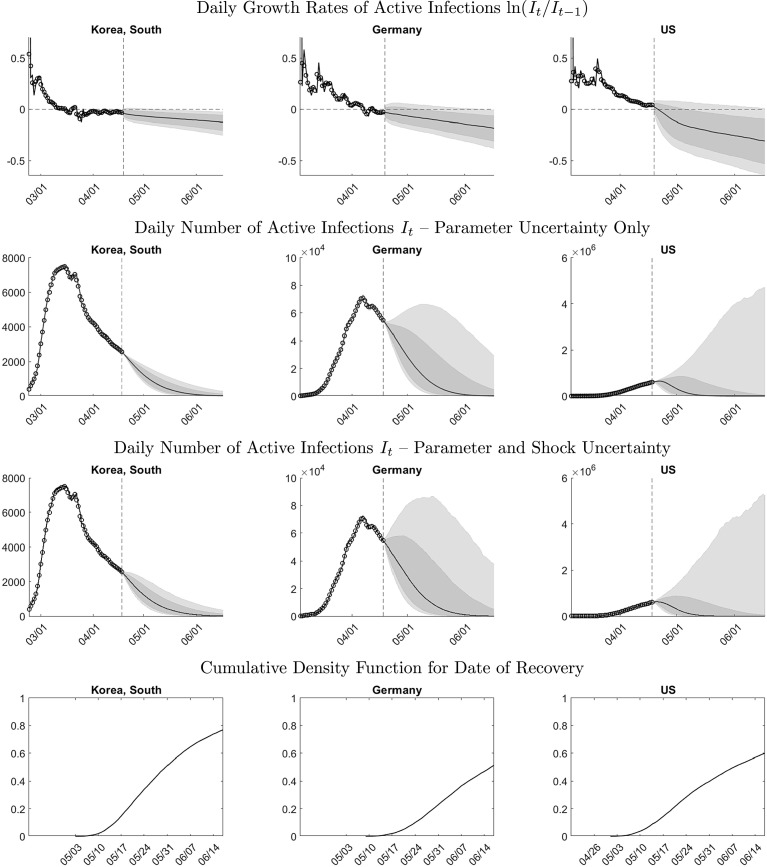
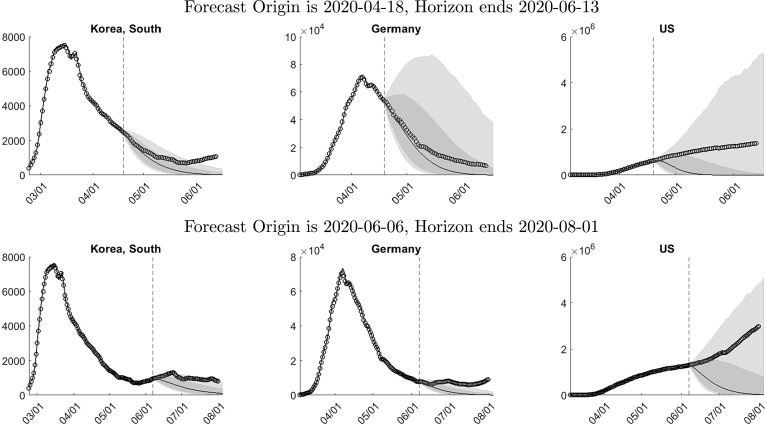
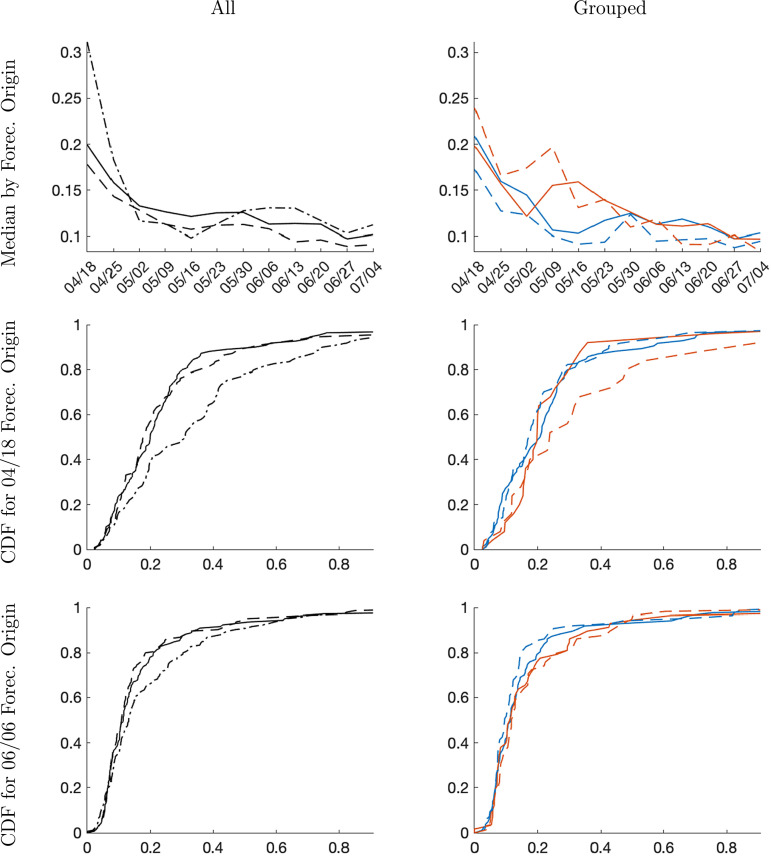
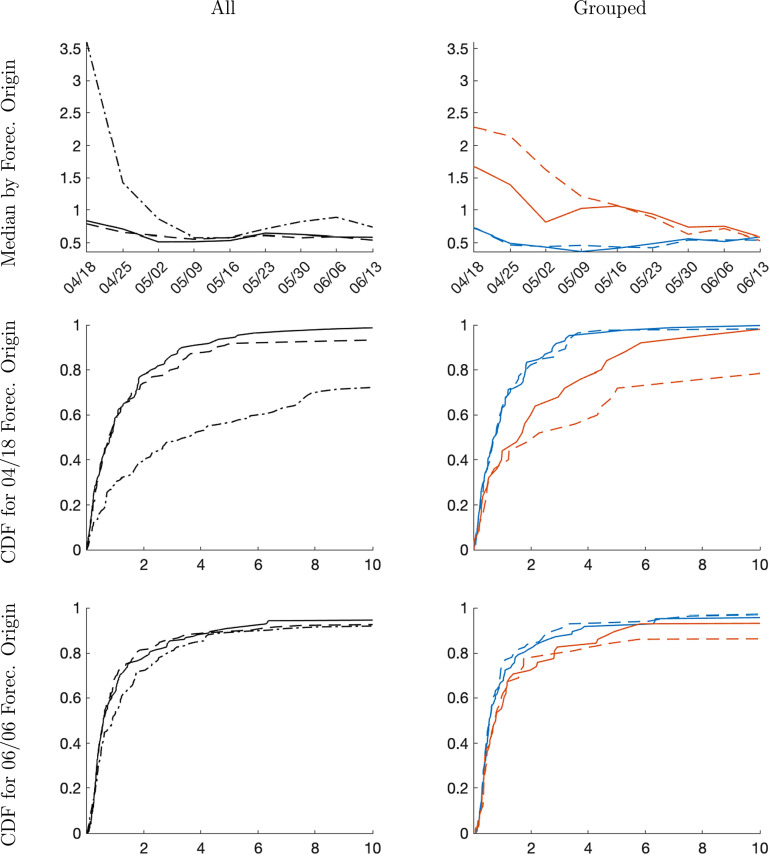
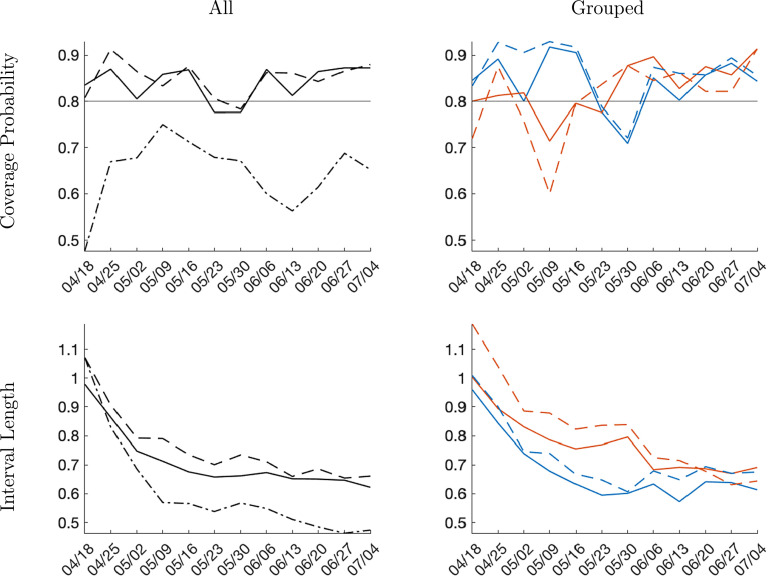
We use a dynamic panel data model to generate density forecasts for daily active Covid-19 infections for a panel of countries/regions. Our specification that assumes the growth rate of active infections can be represented by autoregressive fluctuations around a downward sloping deterministic trend function with a break. Our fully Bayesian approach allows us to flexibly estimate the cross-sectional distribution of slopes and then implicitly use this distribution as prior to construct Bayes forecasts for the individual time series. We find some evidence that information from locations with an early outbreak can sharpen forecast accuracy for late locations. There is generally a lot of uncertainty about the evolution of active infection, due to parameter and shock uncertainty, in particular before and around the peak of the infection path. Over a one-week horizon, the empirical coverage frequency of our interval forecasts is close to the nominal credible level. Weekly forecasts from our model are published at https://laurayuliu.com/covid19-panel-forecast/.

摘要

我们使用动态面板数据模型为一组国家/地区的每日新冠病毒活跃感染病例生成密度预测。我们的设定假设活跃感染病例的增长率可以由围绕具有断点的向下倾斜确定性趋势函数的自回归波动来表示。我们的全贝叶斯方法使我们能够灵活地估计斜率的横截面分布,然后隐含地将此分布用作先验,为各个时间序列构建贝叶斯预测。我们发现一些证据表明,来自疫情早期爆发地区的信息可以提高对疫情后期爆发地区的预测准确性。由于参数和冲击的不确定性,特别是在感染路径的峰值之前和峰值附近,活跃感染病例的演变通常存在很大的不确定性。在一周的时间范围内,我们区间预测的经验覆盖频率接近名义可信水平。我们模型的每周预测结果发布在https://laurayuliu.com/covid19-panel-forecast/ 。

https://cdn.ncbi.nlm.nih.gov/pmc/blobs/ae65/7566698/a58a43b4732c/gr13_lrg.jpg
https://cdn.ncbi.nlm.nih.gov/pmc/blobs/ae65/7566698/0ddb6f7663e2/gr1_lrg.jpg
https://cdn.ncbi.nlm.nih.gov/pmc/blobs/ae65/7566698/f2e7b9a21138/gr2_lrg.jpg
https://cdn.ncbi.nlm.nih.gov/pmc/blobs/ae65/7566698/39fbcd119353/gr3_lrg.jpg
https://cdn.ncbi.nlm.nih.gov/pmc/blobs/ae65/7566698/b66d7e934a20/gr4_lrg.jpg
https://cdn.ncbi.nlm.nih.gov/pmc/blobs/ae65/7566698/439ffed8d938/gr5_lrg.jpg
https://cdn.ncbi.nlm.nih.gov/pmc/blobs/ae65/7566698/9624de6f67b6/gr6_lrg.jpg
https://cdn.ncbi.nlm.nih.gov/pmc/blobs/ae65/7566698/dbcf22226e09/gr7_lrg.jpg
https://cdn.ncbi.nlm.nih.gov/pmc/blobs/ae65/7566698/962534e0f88a/gr8_lrg.jpg
https://cdn.ncbi.nlm.nih.gov/pmc/blobs/ae65/7566698/a39b902ba873/gr9_lrg.jpg
https://cdn.ncbi.nlm.nih.gov/pmc/blobs/ae65/7566698/59bb744a2e7b/gr10_lrg.jpg
https://cdn.ncbi.nlm.nih.gov/pmc/blobs/ae65/7566698/720628f09ed2/gr11_lrg.jpg
https://cdn.ncbi.nlm.nih.gov/pmc/blobs/ae65/7566698/4fbaa73d9f14/gr12_lrg.jpg
https://cdn.ncbi.nlm.nih.gov/pmc/blobs/ae65/7566698/a58a43b4732c/gr13_lrg.jpg

相似文献

1
Panel forecasts of country-level Covid-19 infections.各国新冠病毒感染情况的小组预测。
J Econom. 2021 Jan;220(1):2-22. doi: 10.1016/j.jeconom.2020.08.010. Epub 2020 Oct 16.
2
Near-term phytoplankton forecasts reveal the effects of model time step and forecast horizon on predictability.短期浮游植物预测揭示了模型时间步长和预测时长对可预测性的影响。
Ecol Appl. 2022 Oct;32(7):e2642. doi: 10.1002/eap.2642. Epub 2022 Jun 26.
3
Application of one-, three-, and seven-day forecasts during early onset on the COVID-19 epidemic dataset using moving average, autoregressive, autoregressive moving average, autoregressive integrated moving average, and naïve forecasting methods.使用移动平均、自回归、自回归移动平均、自回归积分移动平均和朴素预测方法,对COVID-19疫情数据集早期发病情况进行1天、3天和7天预测的应用。
Data Brief. 2021 Apr;35:106759. doi: 10.1016/j.dib.2021.106759. Epub 2021 Jan 15.
4
Real-time estimation and forecasting of COVID-19 cases and hospitalizations in Wisconsin HERC regions for public health decision making processes.威斯康星州 HERC 地区实时估计和预测 COVID-19 病例和住院情况,以支持公共卫生决策过程。
BMC Public Health. 2023 Feb 17;23(1):359. doi: 10.1186/s12889-023-15160-6.
5
How New Mexico Leveraged a COVID-19 Case Forecasting Model to Preemptively Address the Health Care Needs of the State: Quantitative Analysis.新墨西哥州如何利用新冠疫情预测模型来预先满足该州的医疗保健需求:定量分析
JMIR Public Health Surveill. 2021 Jun 9;7(6):e27888. doi: 10.2196/27888.
6
Explore a Multivariate Bayesian Uncertainty Processor driven by artificial neural networks for probabilistic PM forecasting.探索基于人工神经网络的多元贝叶斯不确定性处理器在概率性 PM 预测中的应用。
Sci Total Environ. 2020 Apr 1;711:134792. doi: 10.1016/j.scitotenv.2019.134792. Epub 2019 Oct 31.
7
Model-based ensembles: Lessons learned from retrospective analysis of COVID-19 infection forecasts across 10 countries.基于模型的集成:对 10 个国家 COVID-19 感染预测的回顾性分析中得到的经验教训。
Sci Total Environ. 2022 Feb 1;806(Pt 2):150639. doi: 10.1016/j.scitotenv.2021.150639. Epub 2021 Sep 27.
8
Modeling and forecasting the time series of US fertility: age distribution, range, and ultimate level.美国生育率时间序列建模与预测:年龄分布、范围及最终水平
Int J Forecast. 1993 Aug;9(2):187-202. doi: 10.1016/0169-2070(93)90004-7.
9
Analysis and forecasts for trends of COVID-19 in Pakistan using Bayesian models.使用贝叶斯模型对巴基斯坦新冠肺炎趋势进行分析与预测。
PeerJ. 2021 Jul 7;9:e11537. doi: 10.7717/peerj.11537. eCollection 2021.
10
Folic acid supplementation and malaria susceptibility and severity among people taking antifolate antimalarial drugs in endemic areas.在流行地区,服用抗叶酸抗疟药物的人群中,叶酸补充剂与疟疾易感性和严重程度的关系。
Cochrane Database Syst Rev. 2022 Feb 1;2(2022):CD014217. doi: 10.1002/14651858.CD014217.

引用本文的文献

1
Forecasting daily COVID-19 cases with gradient boosted regression trees and other methods: evidence from U.S. cities.用梯度提升回归树和其他方法预测每日 COVID-19 病例:来自美国城市的证据。
Front Public Health. 2023 Dec 11;11:1259410. doi: 10.3389/fpubh.2023.1259410. eCollection 2023.
2
The spread of COVID-19 in London: Network effects and optimal lockdowns.新冠病毒肺炎在伦敦的传播:网络效应与最优封锁措施
J Econom. 2023 Aug;235(2):2125-2154. doi: 10.1016/j.jeconom.2023.02.012. Epub 2023 May 5.
3
Do more stringent policies reduce daily COVID-19 case counts? Evidence from Canadian provinces.

本文引用的文献

1
Nowcasting unemployment insurance claims in the time of COVID-19.新冠疫情期间对失业保险申领情况的实时预测
Int J Forecast. 2022 Apr-Jun;38(2):635-647. doi: 10.1016/j.ijforecast.2021.01.001. Epub 2021 Jan 11.
2
Estimating and simulating a SIRD Model of COVID-19 for many countries, states, and cities.为许多国家、州和城市估计和模拟新冠疫情的易感-感染-康复-死亡(SIRD)模型。
J Econ Dyn Control. 2022 Jul;140:104318. doi: 10.1016/j.jedc.2022.104318. Epub 2022 Jan 29.
3
The challenges of modeling and forecasting the spread of COVID-19.
更严格的政策会降低新冠肺炎每日病例数吗?来自加拿大各省的证据。
Econ Anal Policy. 2023 Jun;78:225-242. doi: 10.1016/j.eap.2023.03.006. Epub 2023 Mar 8.
4
Real-time estimation and forecasting of COVID-19 cases and hospitalizations in Wisconsin HERC regions for public health decision making processes.威斯康星州 HERC 地区实时估计和预测 COVID-19 病例和住院情况,以支持公共卫生决策过程。
BMC Public Health. 2023 Feb 17;23(1):359. doi: 10.1186/s12889-023-15160-6.
5
Estimating the Effects of Non-Pharmaceutical Interventions and Population Mobility on Daily COVID-19 Cases: Evidence from Ontario.评估非药物干预措施和人口流动对每日新冠病毒病例的影响:来自安大略省的证据。
Can Public Policy. 2022 Mar 1;48(1):144-161. doi: 10.3138/cpp.2021-022.
6
Nowcasting unemployment insurance claims in the time of COVID-19.新冠疫情期间对失业保险申领情况的实时预测
Int J Forecast. 2022 Apr-Jun;38(2):635-647. doi: 10.1016/j.ijforecast.2021.01.001. Epub 2021 Jan 11.
7
Estimating and simulating a SIRD Model of COVID-19 for many countries, states, and cities.为许多国家、州和城市估计和模拟新冠疫情的易感-感染-康复-死亡(SIRD)模型。
J Econ Dyn Control. 2022 Jul;140:104318. doi: 10.1016/j.jedc.2022.104318. Epub 2022 Jan 29.
8
Has Omicron Changed the Evolution of the Pandemic?奥密克戎是否改变了大流行的演变?
JMIR Public Health Surveill. 2022 Jan 31;8(1):e35763. doi: 10.2196/35763.
9
Prediction intervals of the COVID-19 cases by HAR models with growth rates and vaccination rates in top eight affected countries: Bootstrap improvement.基于前八大受影响国家的增长率和疫苗接种率的HAR模型对COVID-19病例的预测区间:自助法改进
Chaos Solitons Fractals. 2022 Feb;155:111789. doi: 10.1016/j.chaos.2021.111789. Epub 2022 Jan 3.
10
Modeling and forecasting the COVID-19 pandemic with heterogeneous autoregression approaches: South Korea.运用异质性自回归方法对韩国新冠疫情进行建模与预测
Results Phys. 2021 Oct;29:104631. doi: 10.1016/j.rinp.2021.104631. Epub 2021 Aug 21.
新冠病毒传播建模和预测面临的挑战。
Proc Natl Acad Sci U S A. 2020 Jul 21;117(29):16732-16738. doi: 10.1073/pnas.2006520117. Epub 2020 Jul 2.