Centro de Ciencias de la Atmósfera, Universidad Nacional Autónoma de México, Circuito exterior s/n, Ciudad Universitaria, 04510, Coyoacán, Mexico City, Mexico.
Posgrado en Ciencias de la Tierra, Universidad Nacional Autónoma de México, Circuito exterior s/n, Ciudad Universitaria, 04510, Coyoacán, Mexico City, Mexico; Instituto Nacional de Ecología y Cambio Climático, Blvd. Adolfo Ruíz Cortines 4209, Jardines en la Montaña, 14210, Coyoacan, Mexico City, Mexico.
Sci Total Environ. 2021 Mar 20;761:143183. doi: 10.1016/j.scitotenv.2020.143183. Epub 2020 Oct 22.
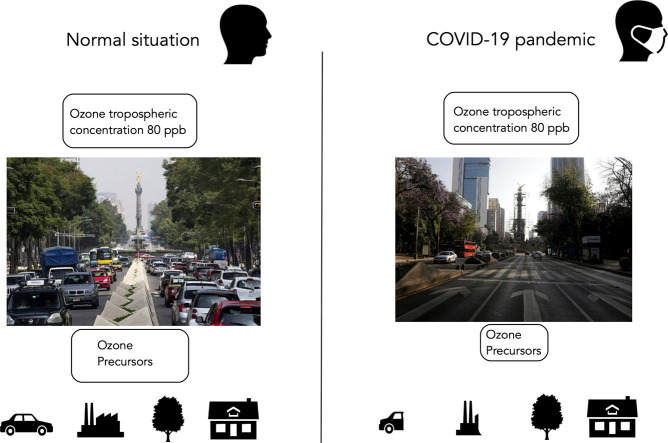
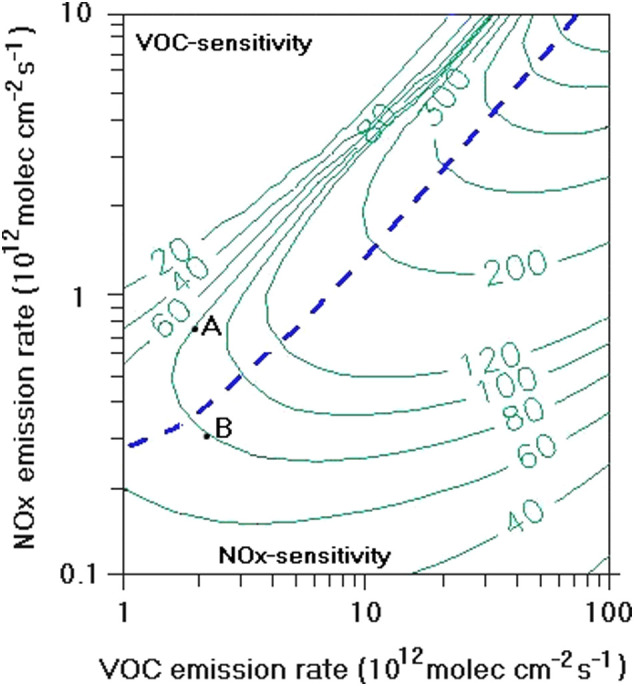
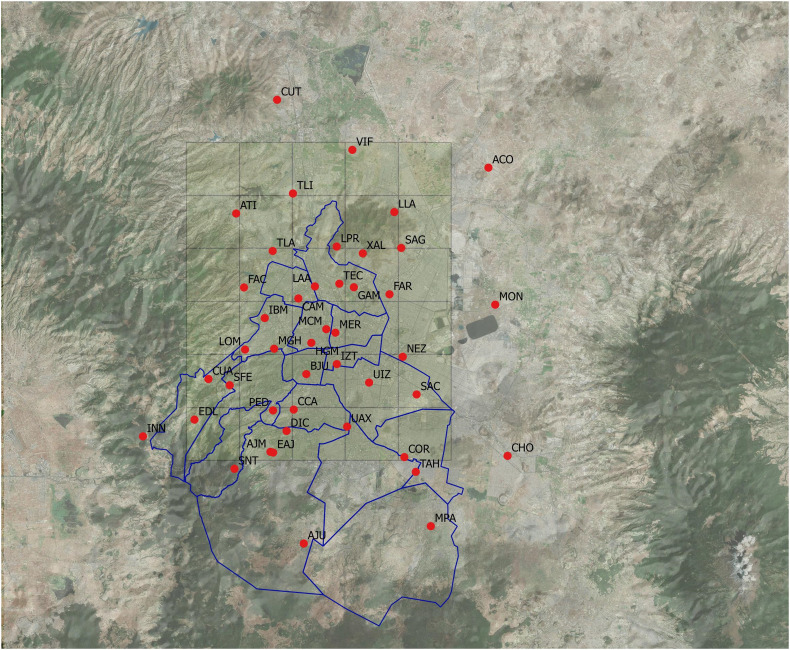
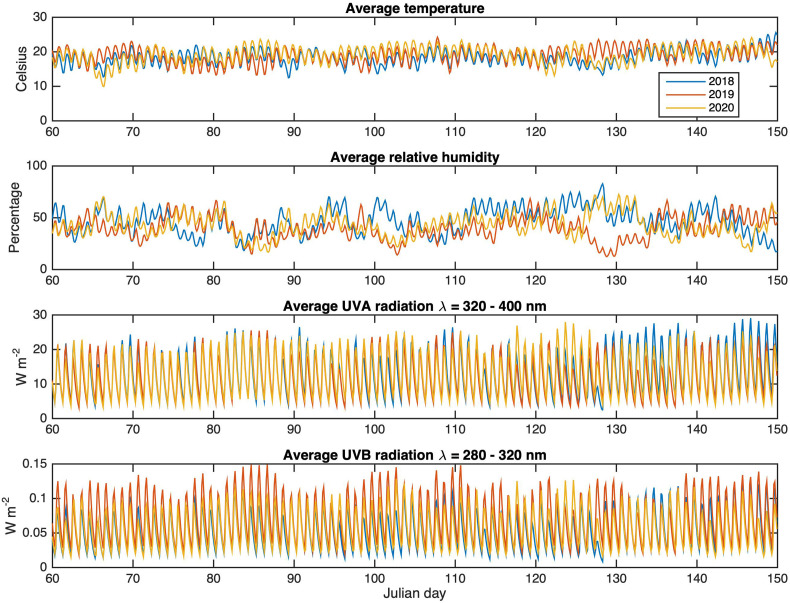
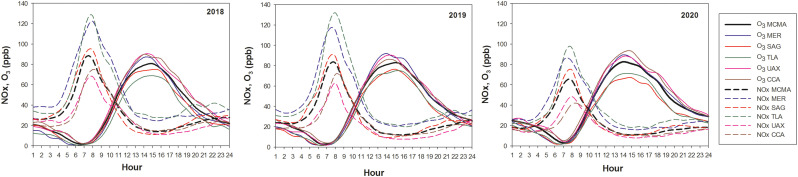
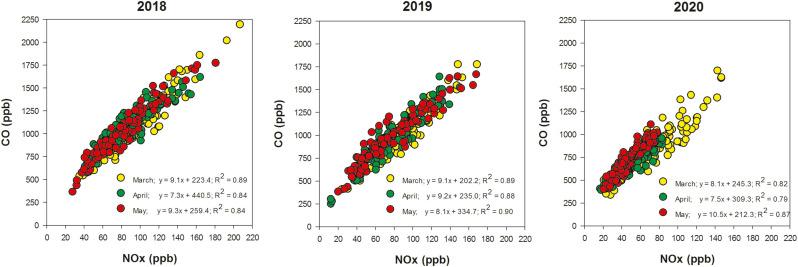
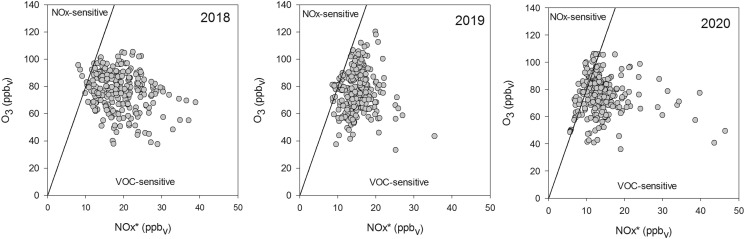
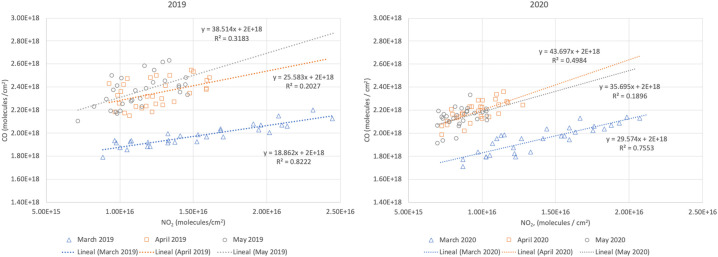
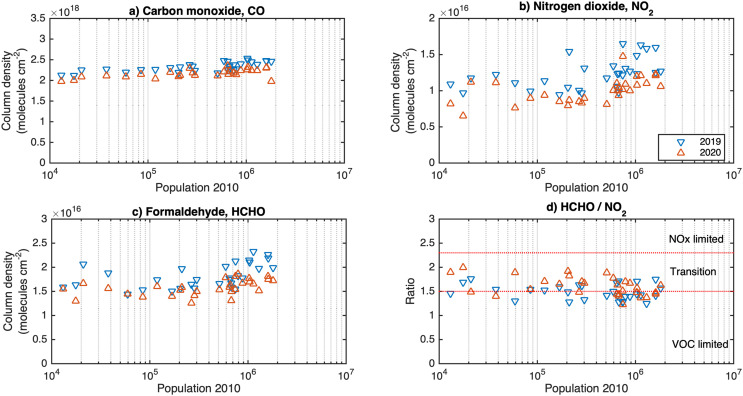
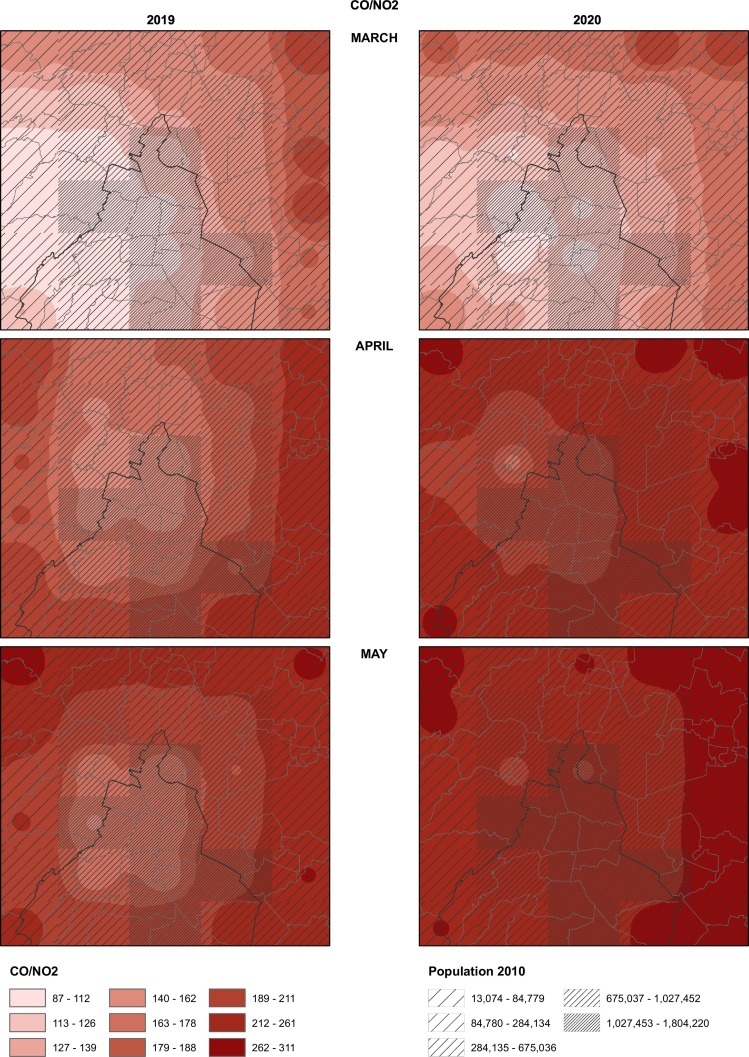
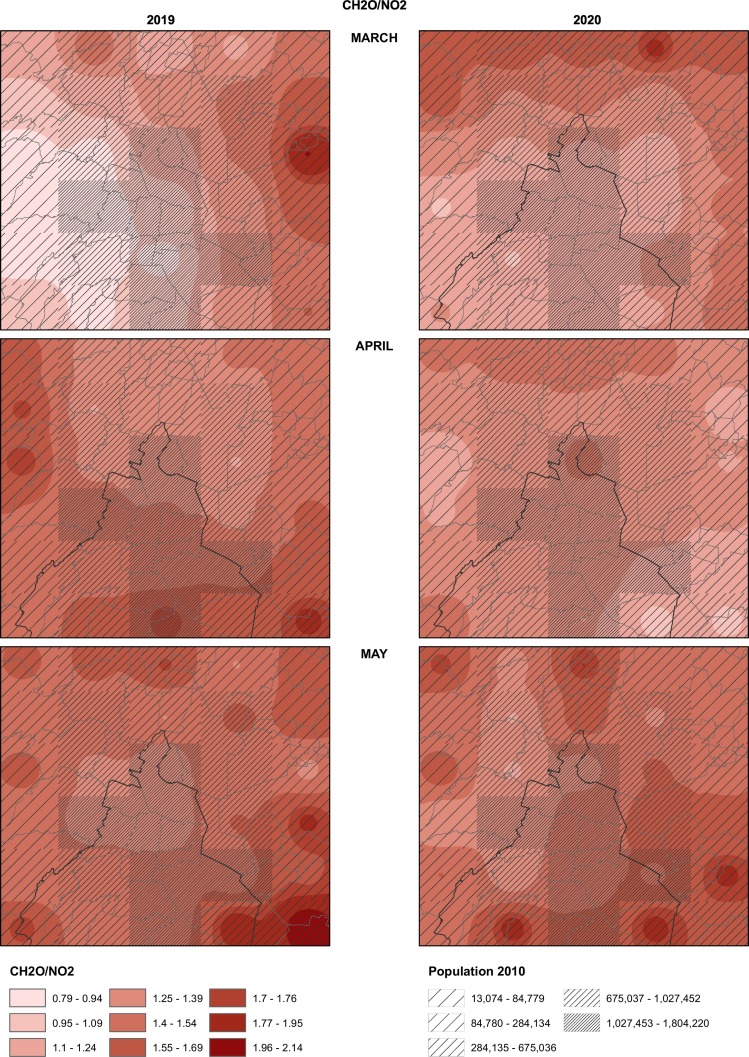
During the COVID-19 pandemic lockdown, emissions of primary criteria pollutants in the Mexico City Metropolitan Area (MCMA) were substantially reduced, as in many other cities in the world. Unexpectedly, the daily average ozone concentration profile was practically indistinguishable from that of the past two years for the same time span in the calendar. So, we compared surface meteorology data, CO, NOx and O hourly concentrations in the MCMA from the ozone season (from March 1 to May 31) for the years 2018, 2019, and 2020. Also, TROPOMI satellite data on column count of CO, NO and HCHO, above a sparse grid of surface points in the MCMA, were also compared for March, April, and May 2020 with those from 2019. Population density used as a background variable to increase understanding of the observed differences allowed us to propose that reductions in NOx were so drastic that ozone formation moved rapidly from a VOC sensitive region towards a NOx sensitive region. The relevance of that unplanned policy provides impacts of contingent short-term emissions control actions during very high pollution episodes. Further analysis of these and other related data concerning VOC speciation and emissions patterns during the coronavirus lockdown may provide guidelines to enhance emission control policies in the post-COVID-19 times to come.
在 COVID-19 大流行封锁期间,墨西哥城大都市区(MCMA)的主要污染物排放大量减少,就像世界上许多其他城市一样。出人意料的是,在同一日历时间段内,臭氧的日平均浓度分布与过去两年的情况几乎没有区别。因此,我们比较了 2018 年、2019 年和 2020 年臭氧季节(3 月 1 日至 5 月 31 日)MCMA 的地面气象数据、CO、NOx 和 O 每小时浓度。此外,还比较了 2020 年 3 月、4 月和 5 月 TROPOMI 卫星数据在 MCMA 稀疏地面点网格上的 CO、NO 和 HCHO 柱数,与 2019 年的数据进行了比较。人口密度作为背景变量,可以增加对观测到的差异的理解,使我们能够提出,NOx 的减少如此剧烈,以至于臭氧的形成迅速从 VOC 敏感区域转移到 NOx 敏感区域。这项未计划的政策的相关性提供了在非常高污染事件期间进行临时短期排放控制行动的影响。进一步分析这些和其他与冠状病毒封锁期间 VOC 专论和排放模式相关的数据,可能为大流行后提供增强排放控制政策的指导方针。