Su Ming, Peng Shushi, Chen Lili, Wang Bin, Wang Ying, Fan Xiarui, Dong Zhaomin
Key Laboratory of Drinking Water Science and Technology, Research Center for Eco-Environmental Sciences Chinese Academy of Sciences Beijing China.
College of Resources and Environment University of Chinese Academy of Science Beijing China.
Geohealth. 2020 Dec 1;4(12):e2020GH000292. doi: 10.1029/2020GH000292. eCollection 2020 Dec.
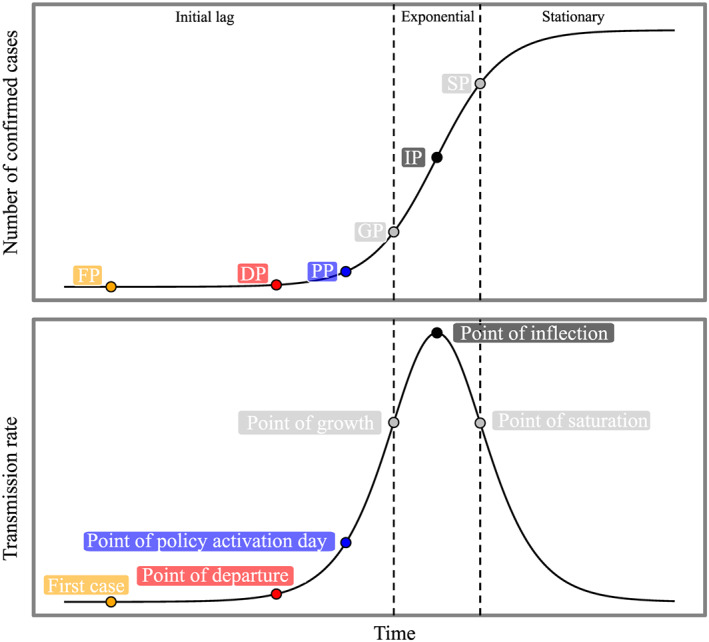
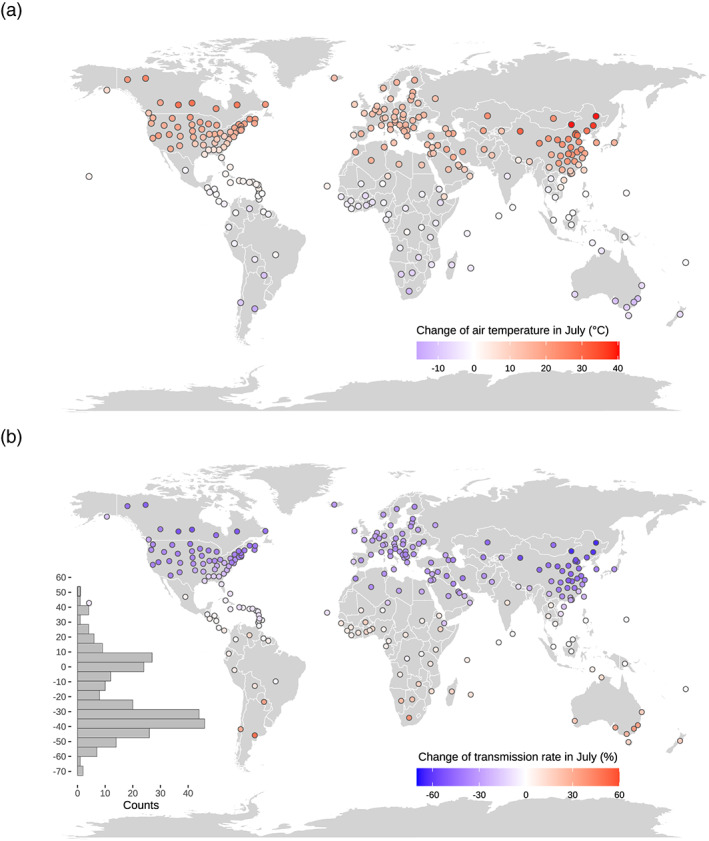
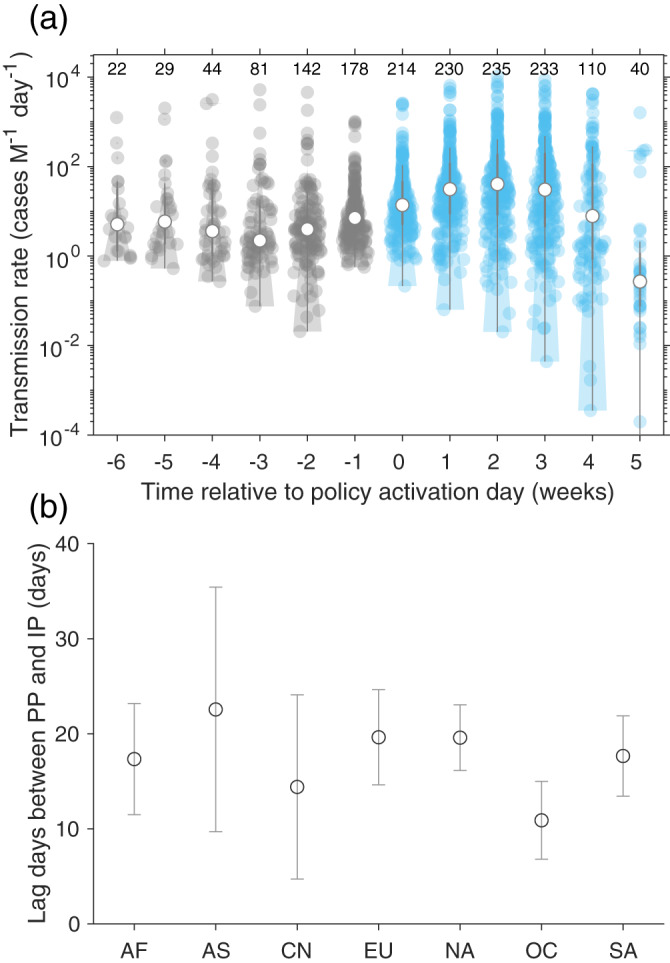
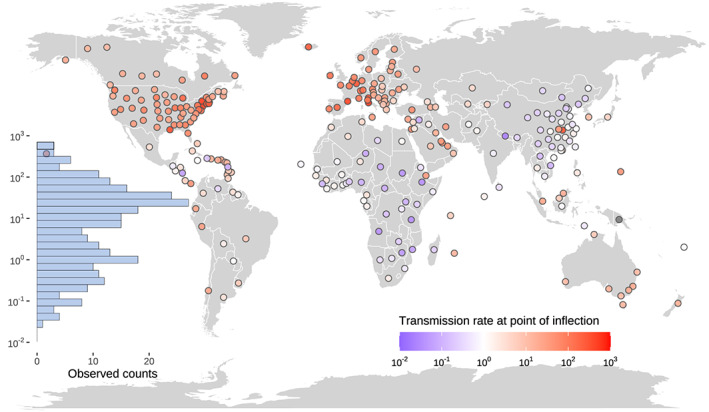
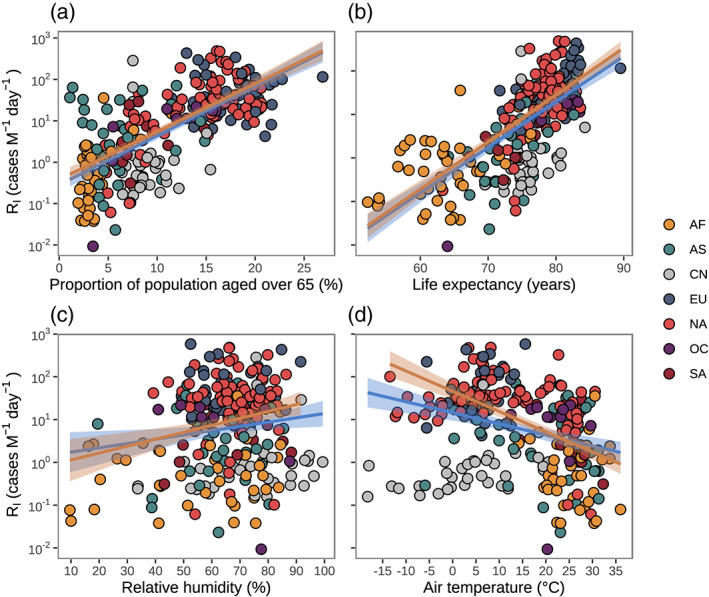
The outbreak of coronavirus disease 2019 (COVID-19) showed various transmission rate ( ) across different regions. The determination of the factors affecting transmission rate is urgent and crucial to combat COVID-19. Here we explored variation of between 277 regions across the globe and the associated potential socioeconomic, demographic, and environmental factors. At global scale, the started to decrease approximately 2 weeks after policy interventions initiated. This lag from the date of policy interventions initiation to the date when started to decrease ranges from 9 to 19 days, largest in Europe and North America. We find that proportion of elderly people or life expectancy can explain ~50% of variation in transmission rate across the 277 regions. The transmission rate at the point of inflection ( ) increases by 29.4% (25.2-34.0%) for 1% uptick in the proportion of people aged above 65, indicating that elderly people face ~2.5 times higher infection risk than younger people. Air temperature is negatively correlated with transmission rate, which is mainly attributed to collinearities between air temperature and demographic factors. Our model predicted that temperature sensitivity of is only -2.7% (-5.2-0%) per degree Celsius after excluding collinearities between air temperature and demographic factors. This low temperature sensitivity of suggests that a warm summer is unlikely to impede the spread of COVID-19 naturally.
2019年冠状病毒病(COVID-19)疫情在不同地区呈现出不同的传播率( )。确定影响传播率的因素对于抗击COVID-19至关重要且刻不容缓。在此,我们探究了全球277个地区之间传播率( )的差异以及相关的潜在社会经济、人口和环境因素。在全球范围内,传播率( )在政策干预开始后约2周开始下降。从政策干预开始日期到传播率( )开始下降的时间间隔为9至19天,在欧洲和北美最长。我们发现,老年人比例或预期寿命可以解释277个地区传播率差异的约50%。65岁以上人群比例每上升1%,拐点处的传播率( )增加29.4%(25.2 - 34.0%),这表明老年人面临的感染风险比年轻人高约2.5倍。气温与传播率呈负相关,这主要归因于气温与人口因素之间的共线性。在排除气温与人口因素之间的共线性后,我们的模型预测传播率( )对温度的敏感度仅为每摄氏度 -2.7%(-5.2 - 0%)。传播率( )对温度的这种低敏感度表明,温暖的夏季不太可能自然地阻碍COVID-19的传播。