Radzevičienė Aurelija, Marquet Pierre, Maslauskienė Rima, Vaičiūnienė Rūta, Kaduševičius Edmundas, Stankevičius Edgaras
Institute of Physiology and Pharmacology, Medical Academy, Lithuanian University of Health Sciences, 9 A. Mickevičiaus Street, LT-44307 Kaunas, Lithuania.
INSERM UMR 850, 87025 Limoges, France.
J Clin Med. 2020 Dec 1;9(12):3903. doi: 10.3390/jcm9123903.
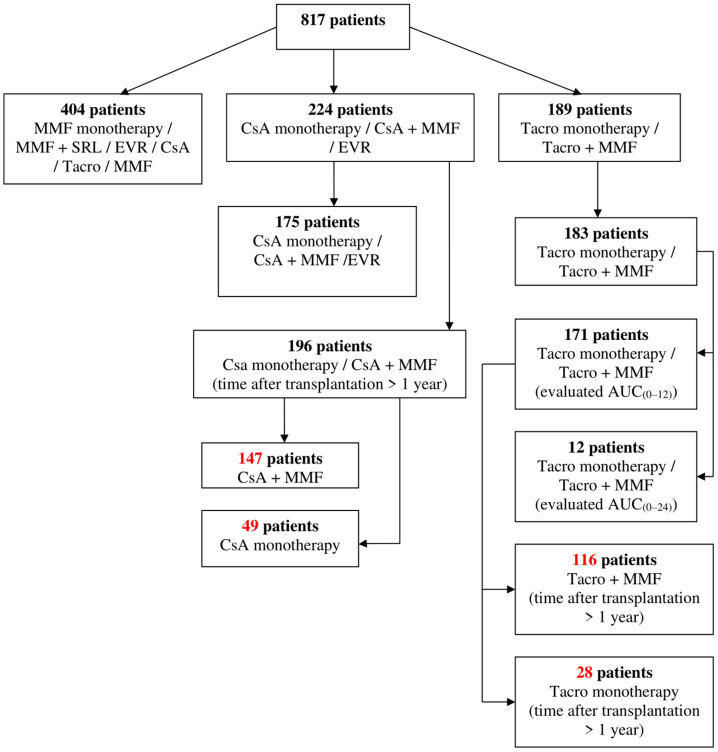
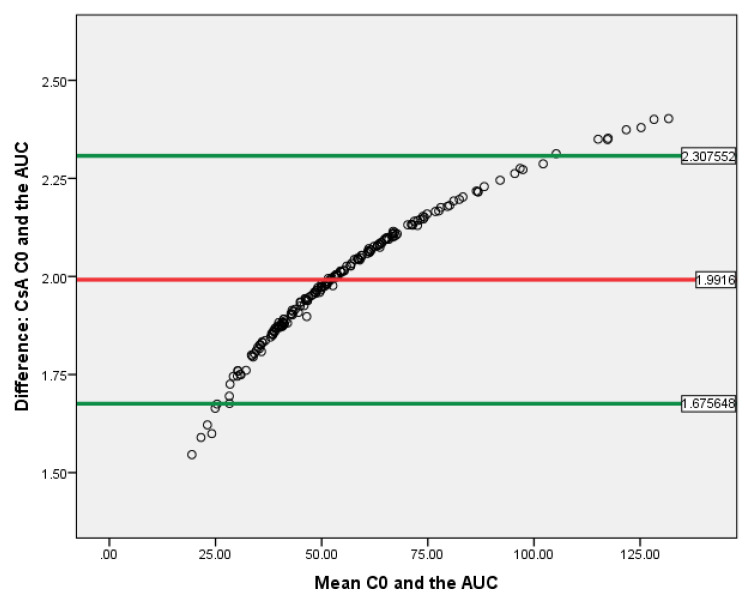
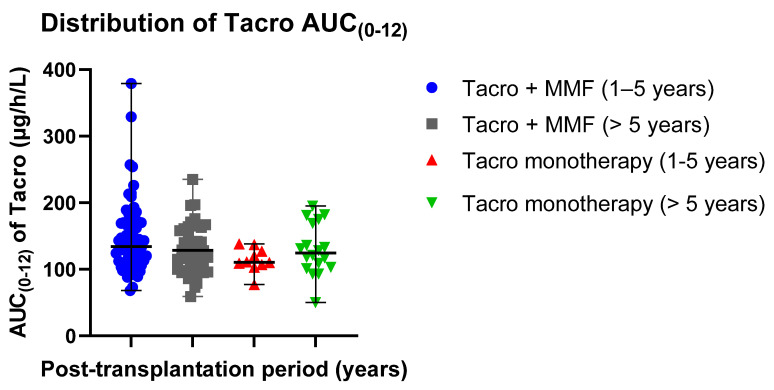
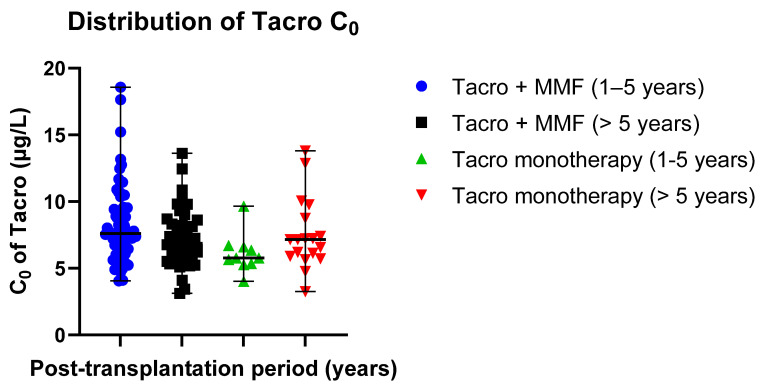
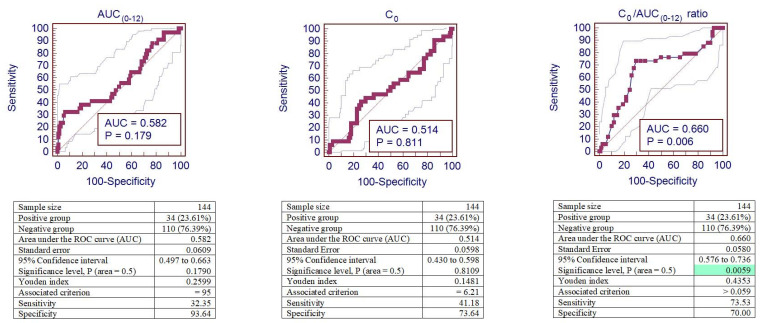
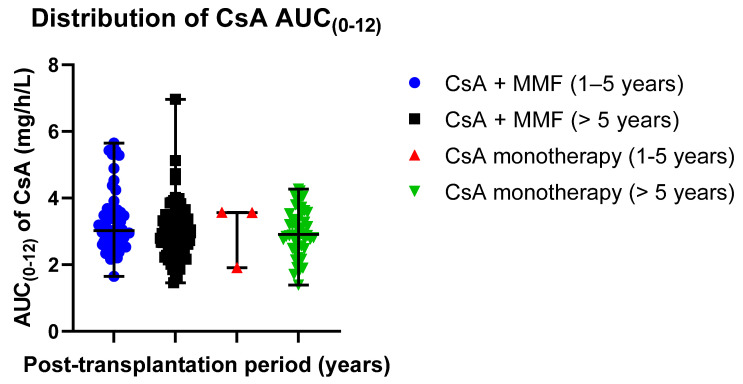
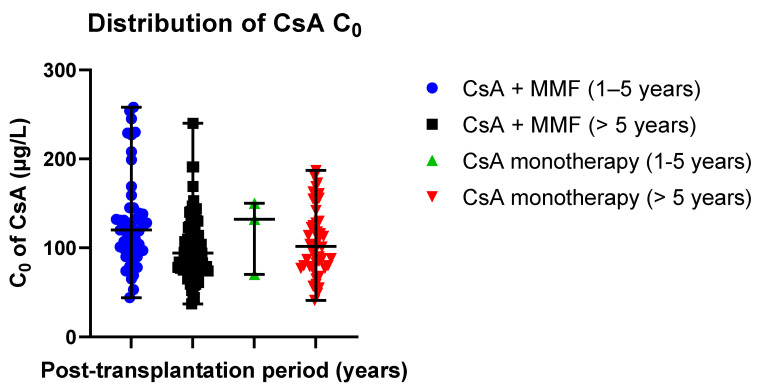
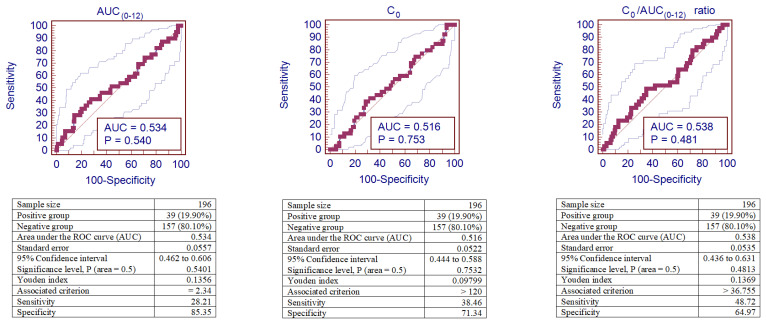
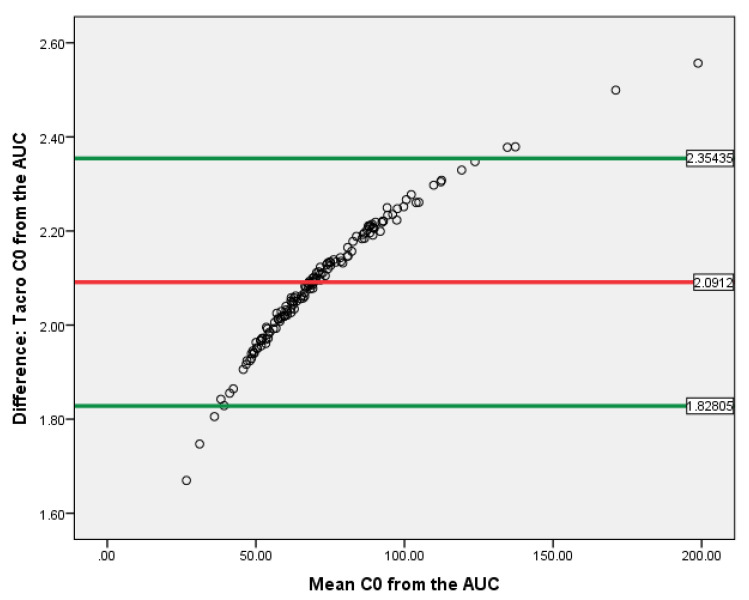
The AUC (area under the concentration time curve) is considered the pharmacokinetic exposure parameter best associated with clinical effects. Unfortunately, no prospective studies of clinical outcomes have been conducted in adult transplant recipients to investigate properly the potential benefits of AUC monitoring compared to the C-guided therapy. The aim of the present study was to compare two methods, C (through level) and AUC (area under the concentration time curve), for assessing cyclosporine and tacrolimus concentrations. The study included 340 kidney recipients. The AUC was estimated using a Bayesian estimator and a three-point limited sampling strategy. Therapeutic drug monitoring of tacrolimus performed by using AUC and C showed that tacrolimus in most cases is overdosed when considering C, while determination of the AUC showed that tacrolimus is effectively dosed for 27.8-40.0% of patients receiving only tacrolimus and for 25.0-31.9% of patients receiving tacrolimus with MMF (mycophenolate mofetil). In the 1-5 years post-transplantation group, 10% higher CsA (cyclosporine) dose was observed, which was proportionate with a 10% higher AUC exposure value. This indicates good compatibility of the dosage and the AUC(0-12) method. The Bland-Altman plot demonstrated that C and AUC might be interchangeable methods, while the ROC (receiver operating characteristic) curve analysis of the C/AUC ratio in the tacrolimus-receiving patient group demonstrated reliable performance to predict IFTA (interstitial fibrosis and tubular atrophy) after kidney transplantation, with an ROC curve of 0.660 (95% confidence interval (CI): 0.576-0.736), < 0.01. Moreover, AUC and C of tacrolimus depend on concomitant medication and adjustment of the therapeutic range for AUC might influence the results.
曲线下面积(AUC,浓度-时间曲线下面积)被认为是与临床效应关联最为紧密的药代动力学暴露参数。遗憾的是,尚未在成年移植受者中开展关于临床结局的前瞻性研究,以恰当探究与基于血药浓度(C)指导的治疗相比,AUC监测的潜在益处。本研究的目的是比较两种评估环孢素和他克莫司浓度的方法,即血药浓度(C,谷值浓度)和曲线下面积(AUC,浓度-时间曲线下面积)。该研究纳入了340名肾移植受者。AUC采用贝叶斯估计器和三点有限采样策略进行估算。通过AUC和C对他克莫司进行治疗药物监测显示,在考虑血药浓度(C)时,多数情况下他克莫司用药过量,而通过AUC测定显示,对于仅接受他克莫司治疗的患者,27.8%-40.0%的患者他克莫司剂量有效,对于接受他克莫司与霉酚酸酯(MMF)联合治疗的患者,25.0%-31.9%的患者他克莫司剂量有效。在移植后1至5年的组中,观察到环孢素(CsA)剂量高出10%,这与高出10%的AUC暴露值相对应。这表明剂量与AUC(0-12)方法具有良好的兼容性。布兰德-奥特曼图表明C和AUC可能是可互换的方法,而在接受他克莫司治疗的患者组中,对C/AUC比值进行的ROC(受试者工作特征)曲线分析显示,其在预测肾移植后间质纤维化和肾小管萎缩(IFTA)方面具有可靠的性能,ROC曲线为0.660(95%置信区间(CI):0.576-0.736),P<0.01。此外,他克莫司的AUC和C取决于合并用药情况,且调整AUC的治疗范围可能会影响结果。