Institute for Physical Activity and Nutrition, School of Exercise and Nutrition Sciences, Deakin University, Geelong, VIC, 3220, Australia.
Center for Epidemiological Research in Nutrition and Health, University of Sao Paulo, Av. Dr. Arnaldo, 715, Sao Paulo, 01246-904, Brazil.
Nutr Diabetes. 2020 Dec 5;10(1):39. doi: 10.1038/s41387-020-00141-0.
Rapid simultaneous increases in ultra-processed food sales and obesity prevalence have been observed worldwide, including in Australia. Consumption of ultra-processed foods by the Australian population was previously shown to be systematically associated with increased risk of intakes of nutrients outside levels recommended for the prevention of obesity. This study aims to explore the association between ultra-processed food consumption and obesity among the Australian adult population and stratifying by age group, sex and physical activity level.
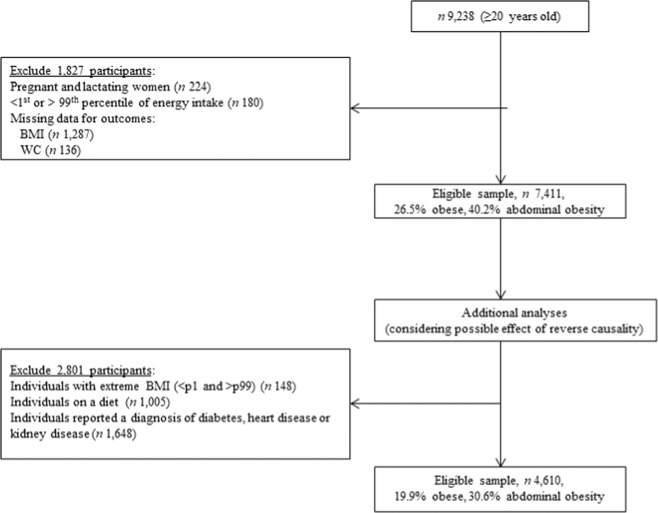
A cross-sectional analysis of anthropometric and dietary data from 7411 Australians aged ≥20 years from the National Nutrition and Physical Activity Survey 2011-2012 was performed. Food consumption was evaluated through 24-h recall. The NOVA system was used to identify ultra-processed foods, i.e. industrial formulations manufactured from substances derived from foods and typically added of flavours, colours and other cosmetic additives, such as soft drinks, confectionery, sweet or savoury packaged snacks, microwaveable frozen meals and fast food dishes. Measured weight, height and waist circumference (WC) data were used to calculate the body mass index (BMI) and diagnosis of obesity and abdominal obesity. Regression models were used to evaluate the association of dietary share of ultra-processed foods (quintiles) and obesity indicators, adjusting for socio-demographic variables, physical activity and smoking.
Significant (P-trend ≤ 0.001) direct dose-response associations between the dietary share of ultra-processed foods and indicators of obesity were found after adjustment. In the multivariable regression analysis, those in the highest quintile of ultra-processed food consumption had significantly higher BMI (0.97 kg/m; 95% CI 0.42, 1.51) and WC (1.92 cm; 95% CI 0.57, 3.27) and higher odds of having obesity (OR = 1.61; 95% CI 1.27, 2.04) and abdominal obesity (OR = 1.38; 95% CI 1.10, 1.72) compared with those in the lowest quintile of consumption. Subgroup analyses showed that the trend towards positive associations for all obesity indicators remained in all age groups, sex and physical activity level.
The findings add to the growing evidence that ultra-processed food consumption is associated with obesity and support the potential role of ultra-processed foods in contributing to obesity in Australia.
超加工食品销售和肥胖患病率的快速同步增长在全球范围内都有观察到,包括在澳大利亚。此前研究表明,澳大利亚人群超加工食品的摄入量与营养摄入超出预防肥胖的推荐水平的风险增加呈系统相关。本研究旨在探索超加工食品消费与澳大利亚成年人群肥胖之间的关系,并按年龄组、性别和身体活动水平进行分层。
对 2011-2012 年澳大利亚全国营养和身体活动调查中 7411 名年龄≥20 岁的澳大利亚人的人体测量和饮食数据进行横断面分析。通过 24 小时回忆来评估食物摄入情况。使用 NOVA 系统识别超加工食品,即由食物衍生的物质制成的工业配方,通常添加有香精、色素和其他美容添加剂,如软饮料、糖果、甜或咸的包装小吃、微波冷冻餐和快餐菜肴。使用测量的体重、身高和腰围(WC)数据计算体重指数(BMI)和肥胖症和腹型肥胖症的诊断。回归模型用于评估超加工食品(五分位数)饮食份额与肥胖指标之间的关联,调整了社会人口统计学变量、身体活动和吸烟情况。
调整后发现,超加工食品饮食份额与肥胖指标之间存在显著的(P-趋势≤0.001)直接剂量反应关联。在多变量回归分析中,超加工食品摄入量最高五分位数的人 BMI(0.97kg/m;95%CI 0.42,1.51)和 WC(1.92cm;95%CI 0.57,3.27)更高,肥胖(OR=1.61;95%CI 1.27,2.04)和腹型肥胖(OR=1.38;95%CI 1.10,1.72)的几率也更高。与最低五分位数的摄入量相比。亚组分析表明,所有肥胖指标的正相关趋势在所有年龄组、性别和身体活动水平中均保持不变。
这些发现增加了越来越多的证据表明,超加工食品的摄入与肥胖有关,并支持超加工食品在澳大利亚导致肥胖的潜在作用。