Memory and Aging Center, Department of Neurology, University of California San Francisco, 675 Nelson Rising Lane, Suite 190, San Francisco, CA, 94143, USA.
Lawrence Berkeley National Laboratory, Berkeley, CA, USA.
Eur J Nucl Med Mol Imaging. 2021 Jul;48(7):2259-2271. doi: 10.1007/s00259-020-05152-8. Epub 2021 Jan 4.
To compare rates of tau biomarker positivity (T-status) per the 2018 Alzheimer's Disease (AD) Research Framework derived from [F]flortaucipir (FTP) PET visual assessment, FTP quantification, and cerebrospinal fluid (CSF) phosphorylated Tau-181 (PTau181).
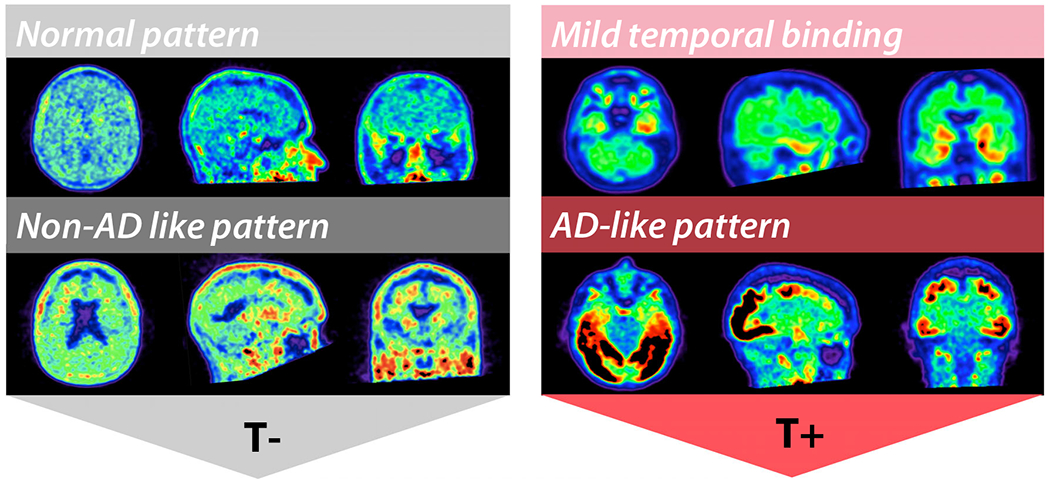
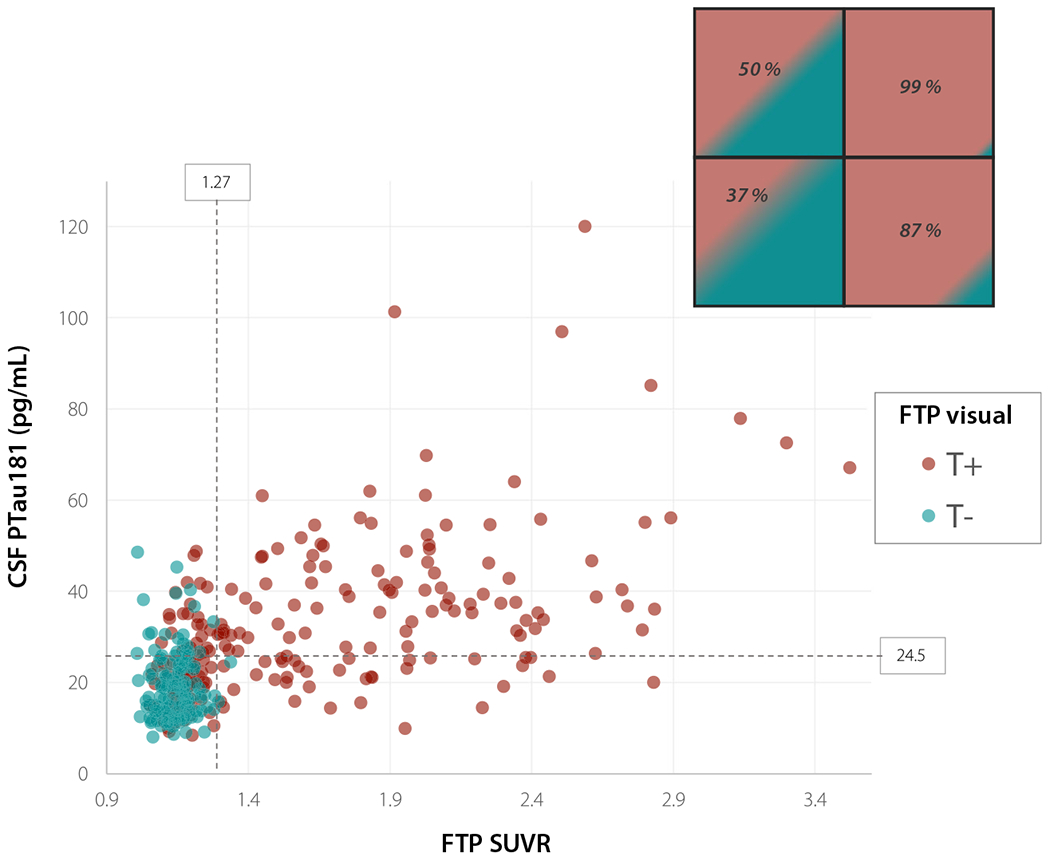
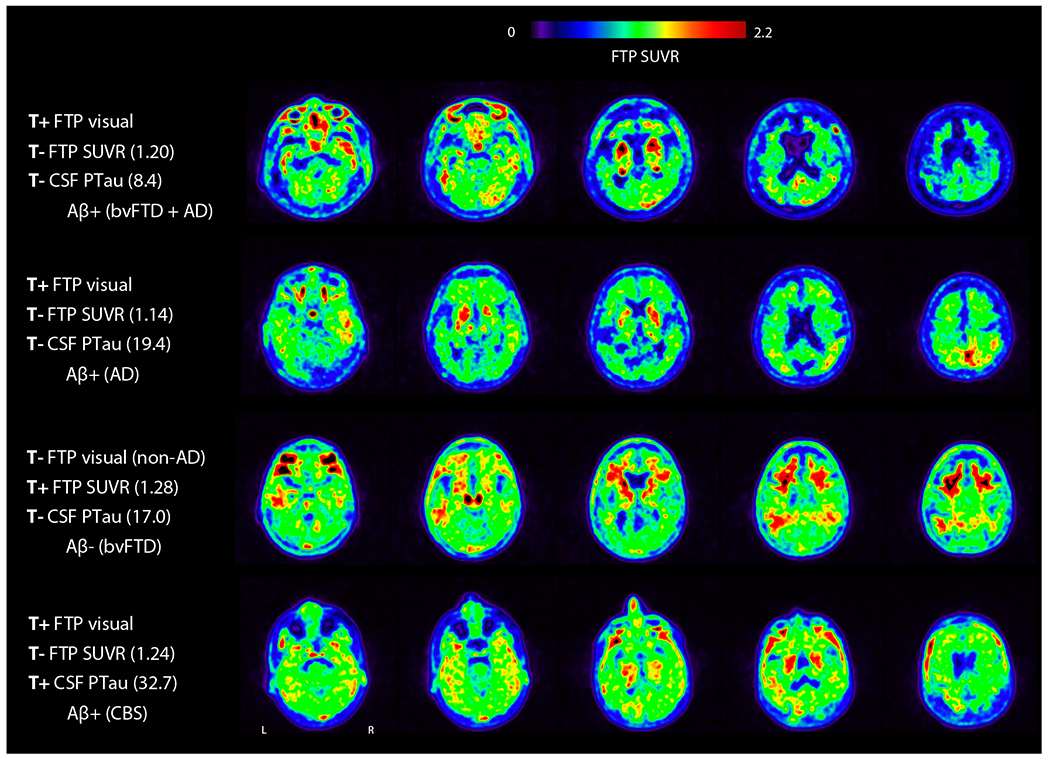
We included 351 subjects with varying clinical diagnoses from three cohorts with available FTP PET and CSF PTau181 within 18 months. T-status was derived from (1) FTP visual assessment by two blinded raters; (2) FTP standardized uptake value ratio (SUVR) quantification from a temporal meta-ROI (threshold: SUVR ≥1.27); and (3) Elecsys® Phospho-Tau (181P) CSF (Roche Diagnostics) concentrations (threshold: PTau181 ≥ 24.5 pg/mL).
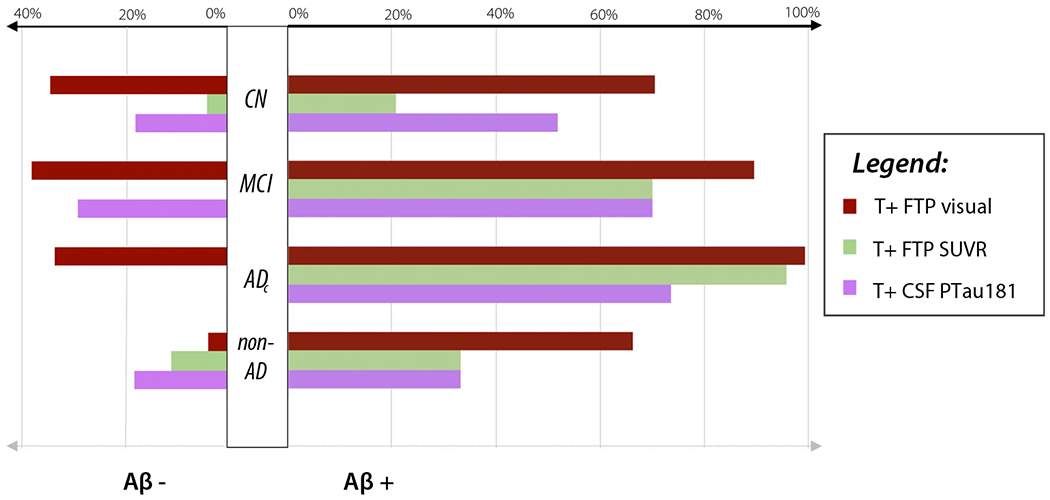
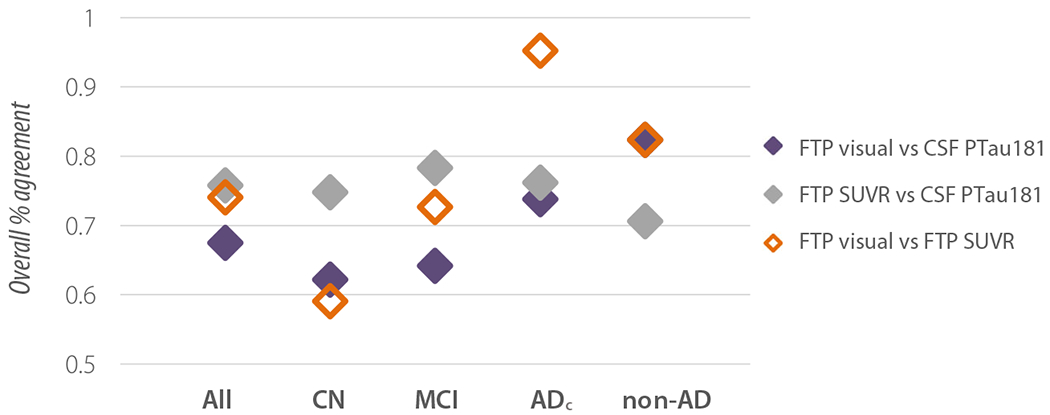
FTP visual reads yielded the highest rates of T+, while T+ by SUVR increased progressively from cognitively normal (CN) through mild cognitive impairment (MCI) and AD dementia. T+ designation by CSF PTau181 was intermediate between FTP visual reads and SUVR values in CN, similar to SUVR in MCI, and lower in AD dementia. Concordance in T-status between modality pairs ranged from 68 to 76% and varied by clinical diagnosis, being highest in patients with AD dementia. In discriminating Aβ + MCI and AD subjects from healthy controls and non-AD participants, FTP visual assessment was most sensitive (0.96) but least specific (0.60). Specificity was highest with FTP SUVR (0.91) with sensitivity of 0.89. Sensitivity (0.73) and specificity (0.72) were balanced for PTau181.
The choice of tau biomarker may differ by disease stage and research goals that seek to maximize sensitivity or specificity. Visual interpretations of tau PET enhance sensitivity compared to quantification alone, particularly in early disease stages.
比较基于[F]flortaucipir(FTP)正电子发射断层扫描(PET)视觉评估、FTP 定量和脑脊液(CSF)磷酸化 Tau-181(PTau181)得出的 2018 年阿尔茨海默病(AD)研究框架下 Tau 生物标志物阳性(T 状态)的比率。
我们纳入了来自三个队列的 351 名具有不同临床诊断的患者,这些患者在 18 个月内均具有可用的 FTP PET 和 CSF PTau181。T 状态是由以下三种方法得出的:(1)两名盲法评分者进行的 FTP 视觉评估;(2)来自颞部 meta-ROI 的 FTP 标准化摄取比值(SUV)定量(阈值:SUVR≥1.27);和(3)Elecsys®磷酸化 Tau(181P)CSF(罗氏诊断公司)浓度(阈值:PTau181≥24.5pg/mL)。
FTP 视觉读数产生了最高的 T+率,而 SUVR 增加的 T+从认知正常(CN)逐渐增加到轻度认知障碍(MCI)和 AD 痴呆。在 CN 中,CSF PTau181 标记的 T+位于 FTP 视觉读数和 SUVR 值之间,与 MCI 中的 SUVR 相似,而在 AD 痴呆中则较低。模态对之间 T 状态的一致性在 68%到 76%之间,并且因临床诊断而异,在 AD 痴呆患者中最高。在将 Aβ+MCI 和 AD 患者与健康对照者和非 AD 参与者区分开来时,FTP 视觉评估最敏感(0.96)但特异性最低(0.60)。FTP SUVR 的特异性最高(0.91),敏感性为 0.89。PTau181 的敏感性(0.73)和特异性(0.72)平衡。
选择 Tau 生物标志物可能因疾病阶段和研究目标而异,这些目标旨在最大限度地提高敏感性或特异性。与单独定量相比,tau PET 的视觉解释提高了敏感性,特别是在早期疾病阶段。