文献检索文档翻译深度研究
Suppr Zotero 插件Zotero 插件
邀请有礼套餐&价格历史记录

新学期,新优惠

限时优惠:9月1日-9月22日

30天高级会员仅需29元

1天体验卡首发特惠仅需5.99元

了解详情
不再提醒
插件&应用
Suppr Zotero 插件Zotero 插件浏览器插件Mac 客户端Windows 客户端微信小程序
高级版
套餐订阅购买积分包
AI 工具
文献检索文档翻译深度研究
关于我们
关于 Suppr公司介绍联系我们用户协议隐私条款
关注我们

Suppr 超能文献

核心技术专利:CN118964589B侵权必究
粤ICP备2023148730 号-1Suppr @ 2025

A simple method for quantitating confocal fluorescent images.

作者信息

Shihan Mahbubul H, Novo Samuel G, Le Marchand Sylvain J, Wang Yan, Duncan Melinda K

机构信息

Department of Biological Sciences, University of Delaware, Newark, DE, 19716, USA.

Delaware Biotechnology Institute, Bioimaging Center, University of Delaware, Newark, DE, 19713, USA.

出版信息

Biochem Biophys Rep. 2021 Feb 1;25:100916. doi: 10.1016/j.bbrep.2021.100916. eCollection 2021 Mar.


DOI:10.1016/j.bbrep.2021.100916
PMID:33553685
原文链接:https://pmc.ncbi.nlm.nih.gov/articles/PMC7856428/
Abstract

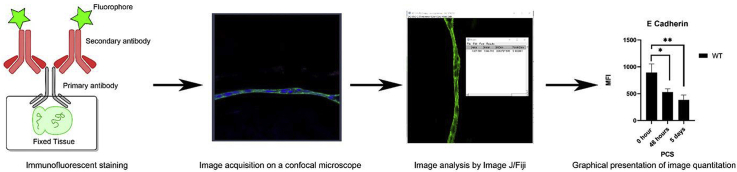
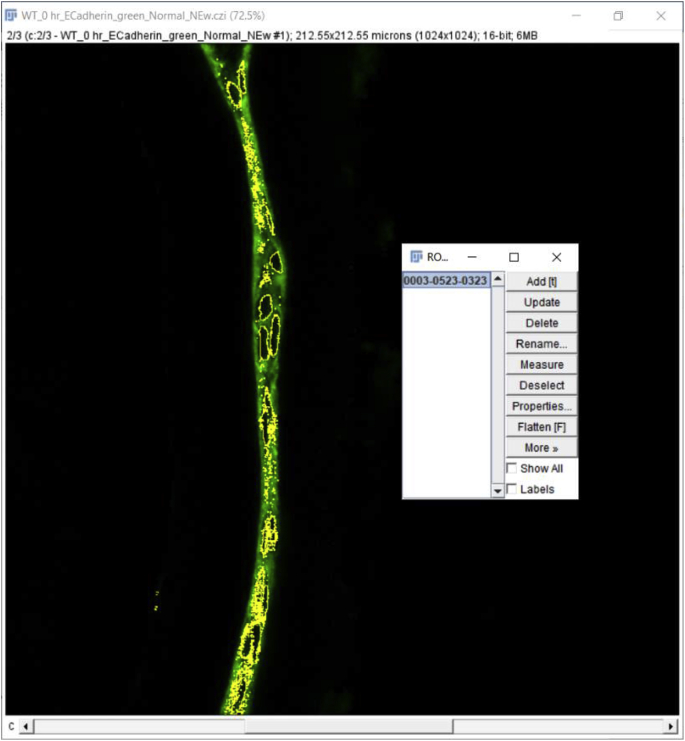
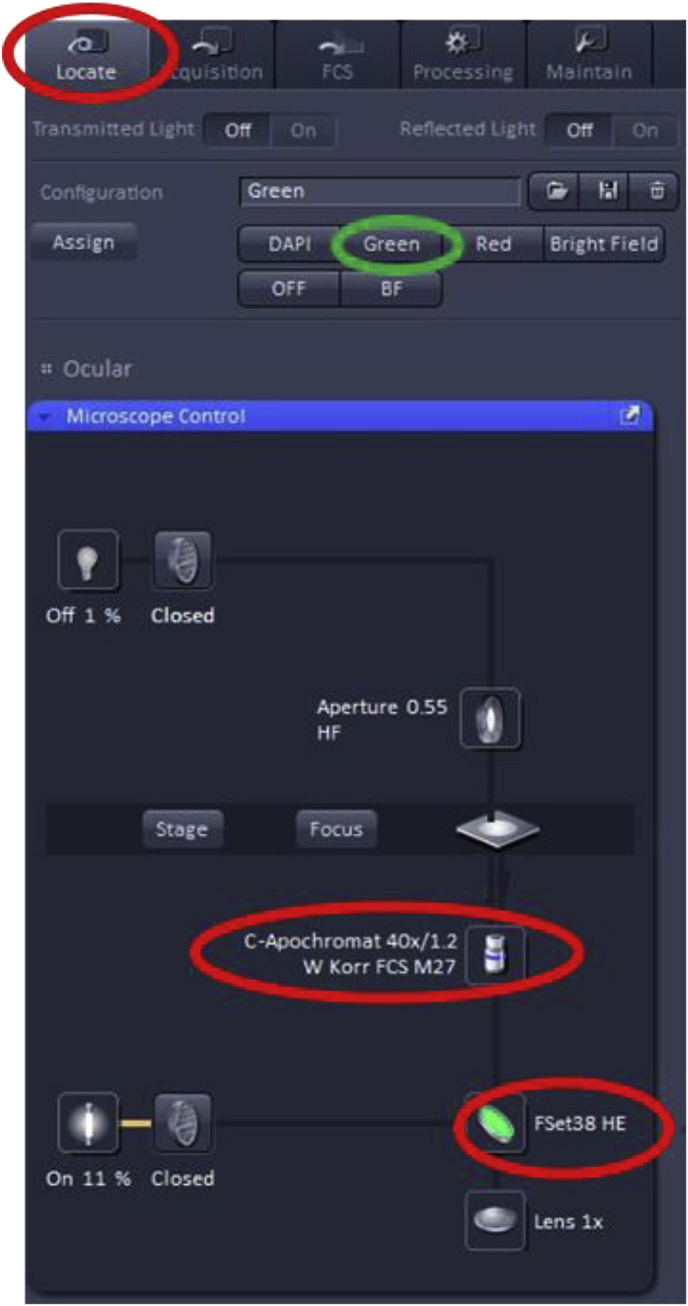
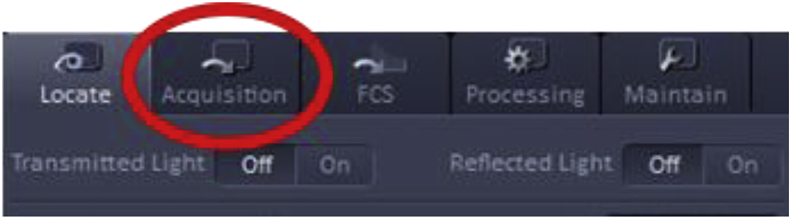
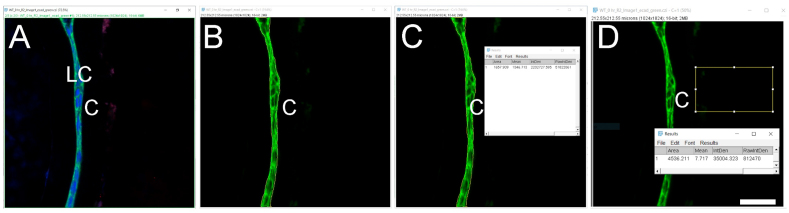
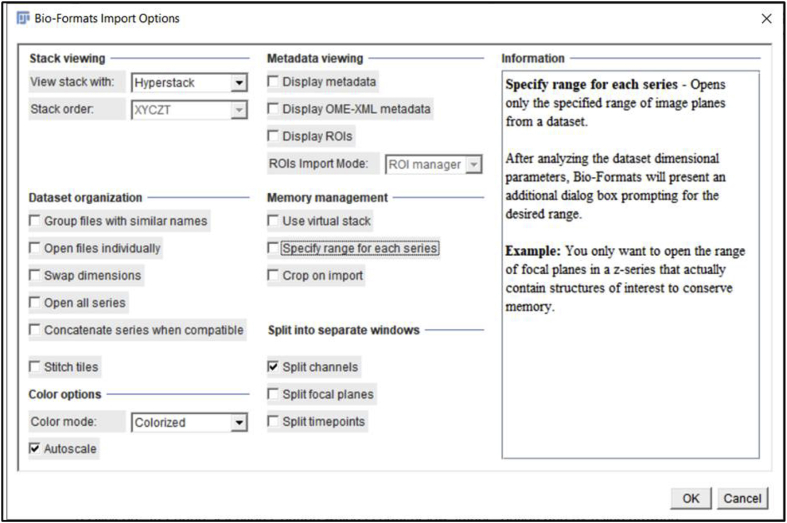
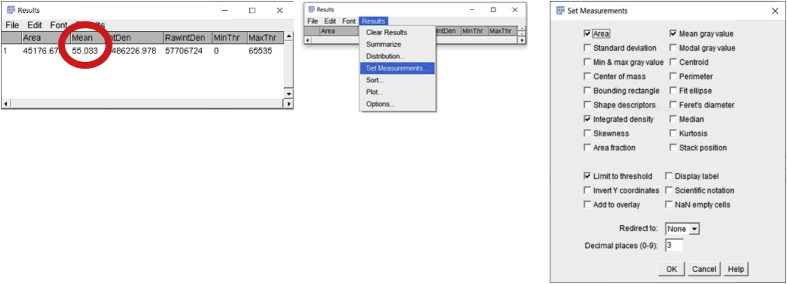
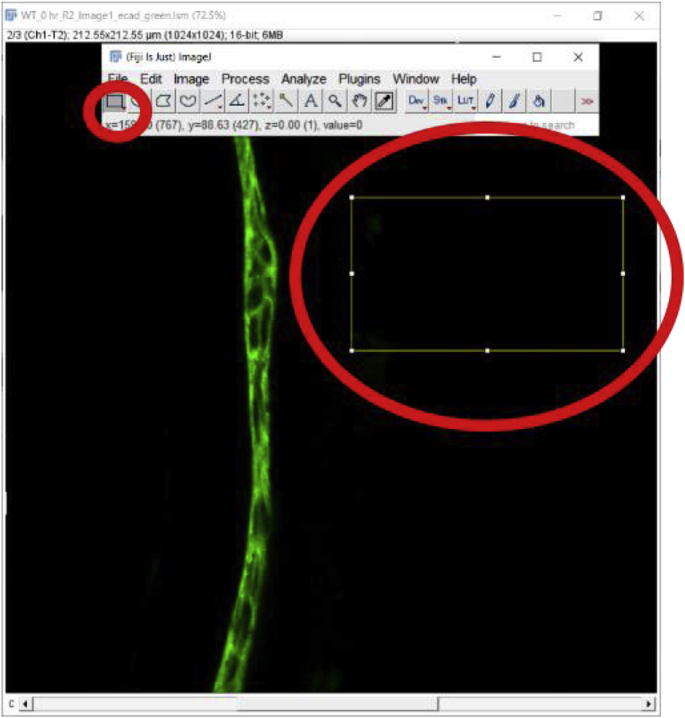
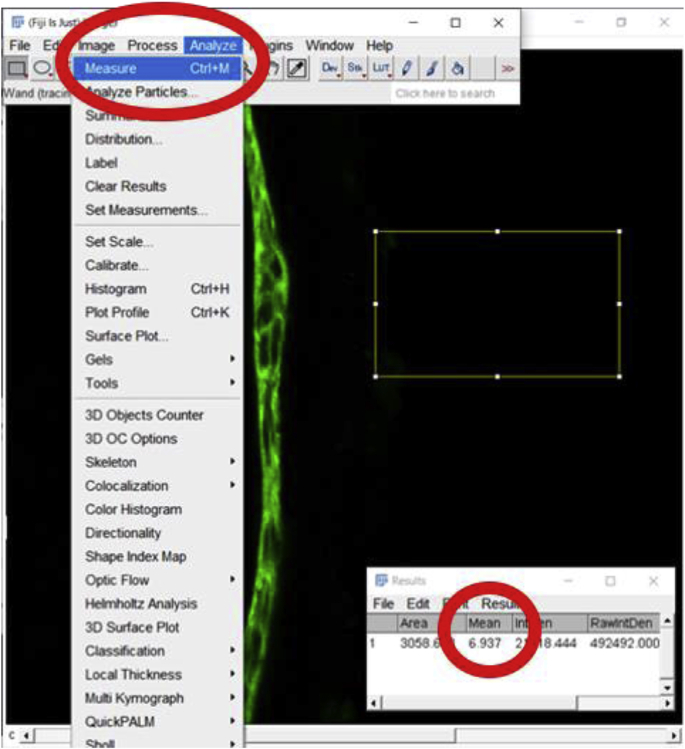
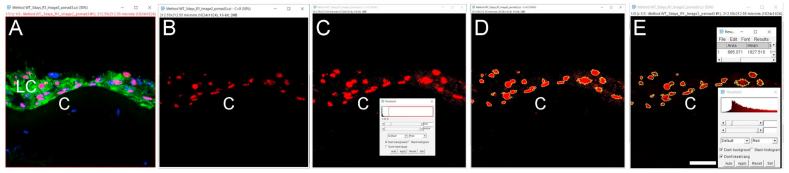
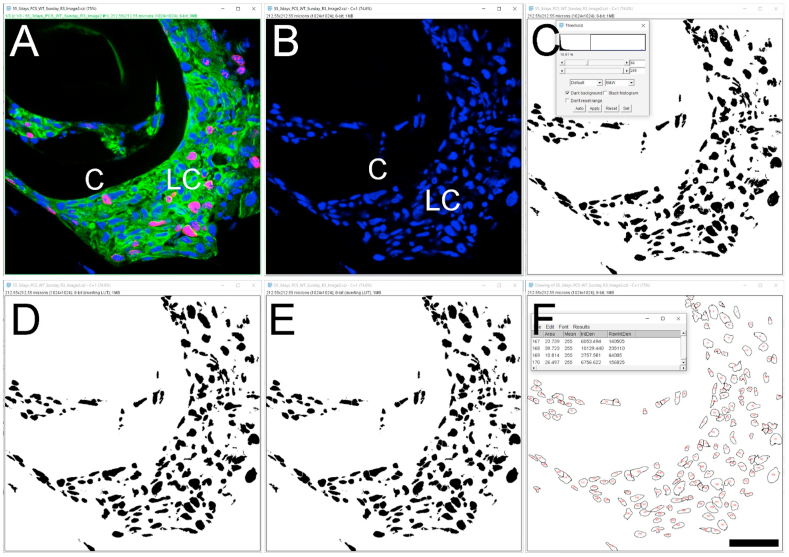
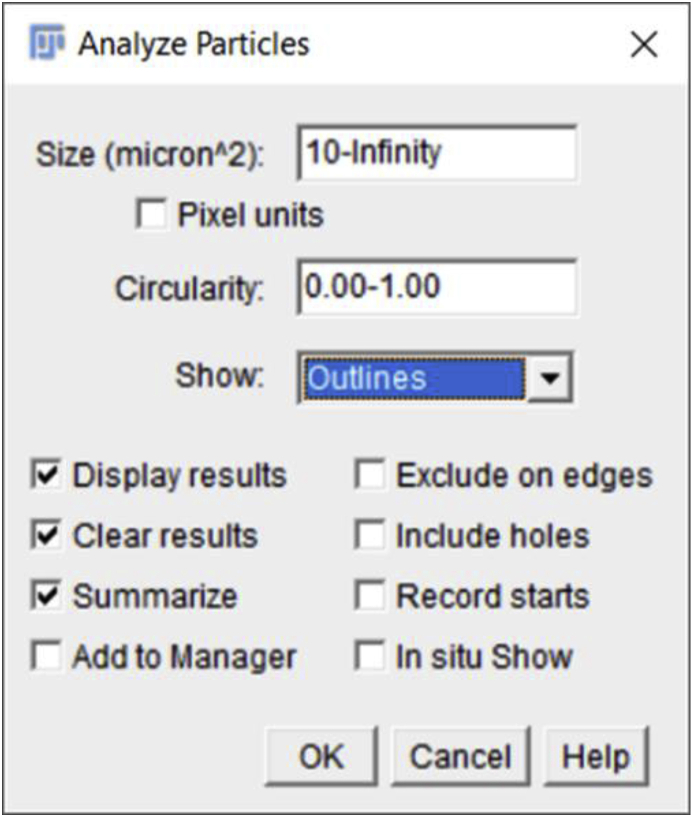
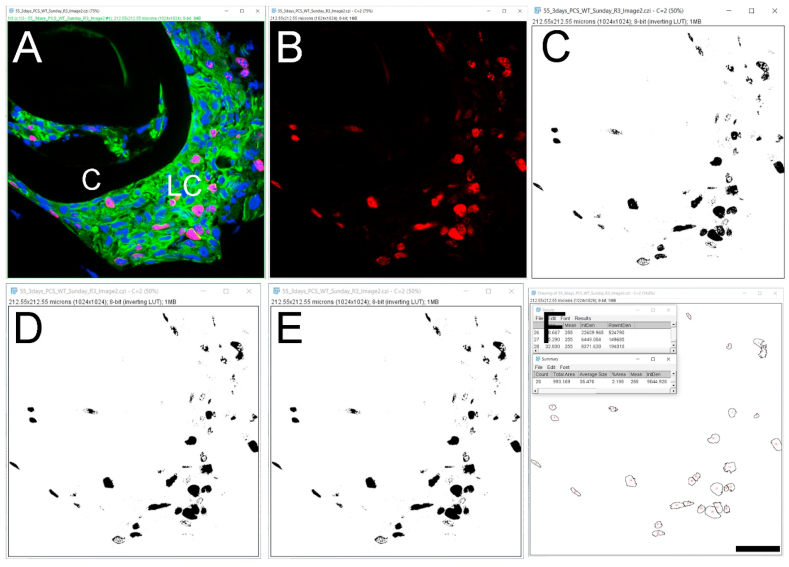
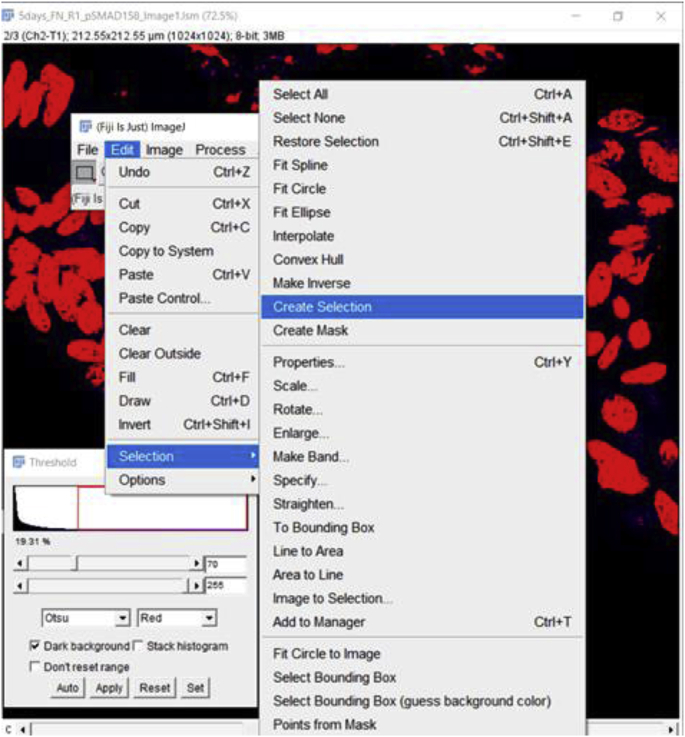
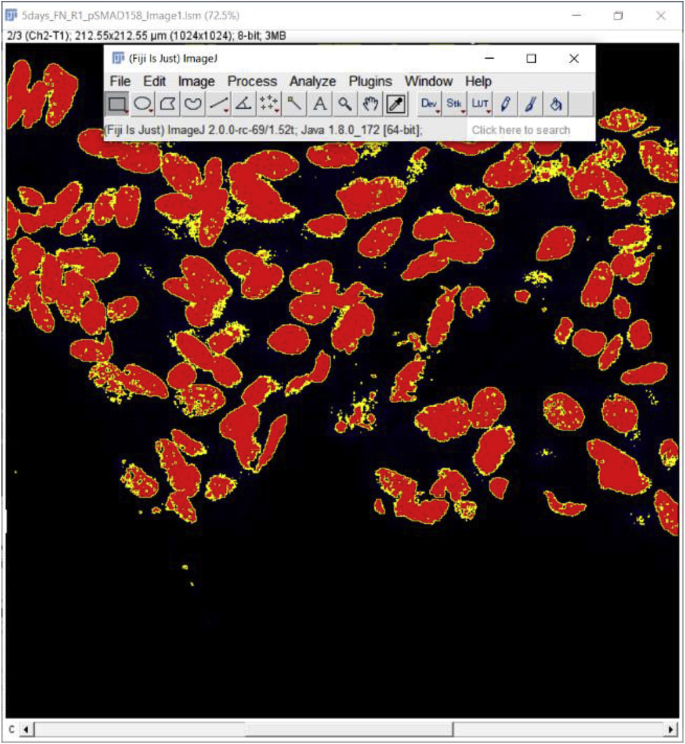
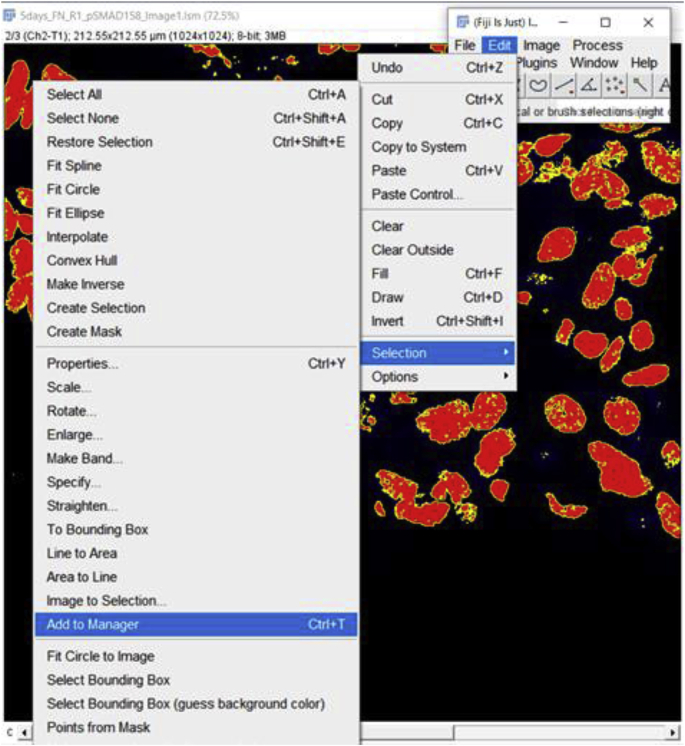
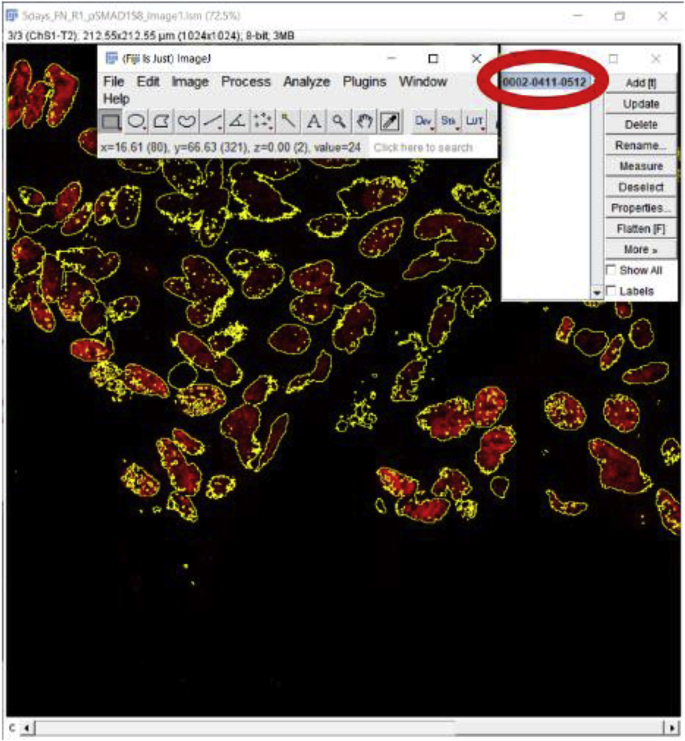
Western blotting (WB), enzyme-linked immunosorbent assay (ELISA) and flow cytometry (FC) have long been used to assess and quantitate relative protein expression in cultured cells and tissue samples. However, WB and ELISA have limited ability to meaningfully quantitate relative protein levels in tissues with complex cell composition, while tissue dissociation followed by FC is not feasible when tissue is limiting and/or cells difficult to isolate. While protein detection in tissue using immunofluorescent (IF) probes has traditionally been considered a qualitative technique, advances in probe stability and confocal imaging allow IF data to be easily quantitated, although reproducible quantitation of relative protein expression requires careful attention to appropriate controls, experiment design, and data collection. Here we describe the methods used to quantify the data presented in et al. which lays out a workflow where IF data collected on a confocal microscope can be used to quantitate the relative levels of a molecule of interest by measuring mean fluorescent intensity across a region of interest, cell number, and the percentage of cells in a sample "positive" for staining with the fluorescent probe of interest. Overall, this manuscript discusses considerations for collecting quantifiable fluorescent images on a confocal microscope and provides explicit methods for quantitating IF data using FIJI-ImageJ.

摘要
https://cdn.ncbi.nlm.nih.gov/pmc/blobs/6094/7856428/358eb9f0ae7c/fx47.jpg
https://cdn.ncbi.nlm.nih.gov/pmc/blobs/6094/7856428/73d795b9520c/fx1.jpg
https://cdn.ncbi.nlm.nih.gov/pmc/blobs/6094/7856428/b9dda0384439/fx2.jpg
https://cdn.ncbi.nlm.nih.gov/pmc/blobs/6094/7856428/220f3c52fb6d/fx3.jpg
https://cdn.ncbi.nlm.nih.gov/pmc/blobs/6094/7856428/9a606046d339/fx4.jpg
https://cdn.ncbi.nlm.nih.gov/pmc/blobs/6094/7856428/81bdb5459ab8/fx5.jpg
https://cdn.ncbi.nlm.nih.gov/pmc/blobs/6094/7856428/4b2e71769fb7/fx6.jpg
https://cdn.ncbi.nlm.nih.gov/pmc/blobs/6094/7856428/024575d7b804/fx7.jpg
https://cdn.ncbi.nlm.nih.gov/pmc/blobs/6094/7856428/5f7b383cae77/fx8.jpg
https://cdn.ncbi.nlm.nih.gov/pmc/blobs/6094/7856428/936a07376f79/fx9.jpg
https://cdn.ncbi.nlm.nih.gov/pmc/blobs/6094/7856428/efde5b6a9afd/fx10.jpg
https://cdn.ncbi.nlm.nih.gov/pmc/blobs/6094/7856428/2ad496b25620/fx11.jpg
https://cdn.ncbi.nlm.nih.gov/pmc/blobs/6094/7856428/e84eeaa6b79d/fx12.jpg
https://cdn.ncbi.nlm.nih.gov/pmc/blobs/6094/7856428/20960783b554/fx13.jpg
https://cdn.ncbi.nlm.nih.gov/pmc/blobs/6094/7856428/42ab6098e0d7/fx14.jpg
https://cdn.ncbi.nlm.nih.gov/pmc/blobs/6094/7856428/667efd84dd44/gr1.jpg
https://cdn.ncbi.nlm.nih.gov/pmc/blobs/6094/7856428/f12ca952c64b/fx15.jpg
https://cdn.ncbi.nlm.nih.gov/pmc/blobs/6094/7856428/643dc42e427f/fx16.jpg
https://cdn.ncbi.nlm.nih.gov/pmc/blobs/6094/7856428/fb3c395e336b/fx17.jpg
https://cdn.ncbi.nlm.nih.gov/pmc/blobs/6094/7856428/80d2c372f7d8/fx18.jpg
https://cdn.ncbi.nlm.nih.gov/pmc/blobs/6094/7856428/f12bfe13d7f5/fx19.jpg
https://cdn.ncbi.nlm.nih.gov/pmc/blobs/6094/7856428/3e4f8e00eb8a/fx20.jpg
https://cdn.ncbi.nlm.nih.gov/pmc/blobs/6094/7856428/4bb6e1f17800/fx21.jpg
https://cdn.ncbi.nlm.nih.gov/pmc/blobs/6094/7856428/045839ee7a7b/fx22.jpg
https://cdn.ncbi.nlm.nih.gov/pmc/blobs/6094/7856428/5bb833d83d22/fx23.jpg
https://cdn.ncbi.nlm.nih.gov/pmc/blobs/6094/7856428/ce401fd16301/fx24.jpg
https://cdn.ncbi.nlm.nih.gov/pmc/blobs/6094/7856428/22efa41553bc/fx25.jpg
https://cdn.ncbi.nlm.nih.gov/pmc/blobs/6094/7856428/3efee328fb86/fx26.jpg
https://cdn.ncbi.nlm.nih.gov/pmc/blobs/6094/7856428/2cb11d0598f2/fx27.jpg
https://cdn.ncbi.nlm.nih.gov/pmc/blobs/6094/7856428/ff224e66754b/fx28.jpg
https://cdn.ncbi.nlm.nih.gov/pmc/blobs/6094/7856428/709c686778e9/fx29.jpg
https://cdn.ncbi.nlm.nih.gov/pmc/blobs/6094/7856428/8602555e011c/fx30.jpg
https://cdn.ncbi.nlm.nih.gov/pmc/blobs/6094/7856428/467fd05b9174/fx31.jpg
https://cdn.ncbi.nlm.nih.gov/pmc/blobs/6094/7856428/1d9be2d861c4/gr2.jpg
https://cdn.ncbi.nlm.nih.gov/pmc/blobs/6094/7856428/cc31bd8c19f8/fx32.jpg
https://cdn.ncbi.nlm.nih.gov/pmc/blobs/6094/7856428/94a3a5ef0dc0/fx33.jpg
https://cdn.ncbi.nlm.nih.gov/pmc/blobs/6094/7856428/cde4f0afec81/fx34.jpg
https://cdn.ncbi.nlm.nih.gov/pmc/blobs/6094/7856428/a4bb558a1469/fx35.jpg
https://cdn.ncbi.nlm.nih.gov/pmc/blobs/6094/7856428/a720ae117429/fx36.jpg
https://cdn.ncbi.nlm.nih.gov/pmc/blobs/6094/7856428/a44c5b78ffc7/fx37.jpg
https://cdn.ncbi.nlm.nih.gov/pmc/blobs/6094/7856428/df970c53f900/gr3.jpg
https://cdn.ncbi.nlm.nih.gov/pmc/blobs/6094/7856428/183d6e5a260a/fx38.jpg
https://cdn.ncbi.nlm.nih.gov/pmc/blobs/6094/7856428/9311be673ed4/gr4.jpg
https://cdn.ncbi.nlm.nih.gov/pmc/blobs/6094/7856428/1bd2b4558696/gr5.jpg
https://cdn.ncbi.nlm.nih.gov/pmc/blobs/6094/7856428/f8184572d92c/fx39.jpg
https://cdn.ncbi.nlm.nih.gov/pmc/blobs/6094/7856428/d10379844837/gr6.jpg
https://cdn.ncbi.nlm.nih.gov/pmc/blobs/6094/7856428/c9d04c0f50de/fx41.jpg
https://cdn.ncbi.nlm.nih.gov/pmc/blobs/6094/7856428/2362dfb24ef4/fx42.jpg
https://cdn.ncbi.nlm.nih.gov/pmc/blobs/6094/7856428/cca0b7af5836/fx43.jpg
https://cdn.ncbi.nlm.nih.gov/pmc/blobs/6094/7856428/37e605acbc88/fx45.jpg
https://cdn.ncbi.nlm.nih.gov/pmc/blobs/6094/7856428/358eb9f0ae7c/fx47.jpg

相似文献

[1]
A simple method for quantitating confocal fluorescent images.

Biochem Biophys Rep. 2021-2-1

[2]
Unbiased automated quantitation of ROS signals in live retinal neurons of using Fiji/ImageJ.

Biotechniques. 2021-8

[3]
Considerations when quantitating protein abundance by immunoblot.

Am J Physiol Cell Physiol. 2015-3-15

[4]
LSM-W: laser scanning microscopy worker for wheat leaf surface morphology.

BMC Syst Biol. 2019-3-5

[5]
Localizing Proteins in Fixed Giardia lamblia and Live Cultured Mammalian Cells by Confocal Fluorescence Microscopy.

Methods Mol Biol. 2016

[6]
Quantitation and visualization of ultraviolet-induced DNA damage using specific antibodies: application to pigment cell biology.

Pigment Cell Res. 2001-4

[7]
A Fiji process for quantifying fluorescent puncta in linear cellular structures.

MicroPubl Biol. 2023-12-14

[8]
Intensity correction of fluorescent confocal laser scanning microscope images by mean-weight filtering.

J Microsc. 2006-2

[9]
Semi-automatized segmentation method using image-based flow cytometry to study sperm physiology: the case of capacitation-induced tyrosine phosphorylation.

Mol Hum Reprod. 2018-2-1

[10]
Quantitation of Chlamydia trachomatis by culture, direct immunofluorescence and competitive polymerase chain reaction.

Genitourin Med. 1995-8

引用本文的文献

[1]
Biochar pre-conditioning reduces nanoplastic toxicity to plant growth-promoting bacteria.

RSC Adv. 2025-8-18

[2]
PKC- Regulates an Oncogenic Positive Feedback Loop Between the MAPK/JNK Signaling Pathway, c-Jun/AP-1 and TNF- in Breast Cancer.

Int J Mol Sci. 2025-7-28

[3]
A Genetically-Engineered Thyroid Gland Built for Selective Triiodothyronine Secretion.

Int J Mol Sci. 2025-7-24

[4]
CXCR1 Fate-Mapping In Vivo Distinguishes Cochlear Resident and Recruited Macrophages After Acoustic Trauma.

bioRxiv. 2025-8-13

[5]
Vaccination with Acinetobacter baumannii adhesin Abp2D provides protection against catheter-associated urinary tract infection.

Nat Commun. 2025-8-9

[6]
GM-CSF potentiates macrophages to retain an inflammatory feature from their circulating monocyte precursors in rheumatoid arthritis.

J Transl Med. 2025-8-7

[7]
L-Arabinose Alters the Transcriptome to Favor Biofilm Growth and Enhances Survival During Fluoroquinolone Stress.

Microorganisms. 2025-7-15

[8]
Characterizing the Impact of Fabrication Methods on Mechanically Tunable Gelatin Hydrogels for Cardiac Fibrosis Studies.

Bioengineering (Basel). 2025-7-13

[9]
LIRTS Viewer: A Web-Based Resource to View the Transcriptional Response of Lens Epithelial Cells to Injury.

Invest Ophthalmol Vis Sci. 2025-7-1

[10]
Gpr37 modulates the severity of inflammation-induced GI dysmotility by regulating enteric reactive gliosis.

iScience. 2025-6-16

本文引用的文献

[1]
Fibronectin has multifunctional roles in posterior capsular opacification (PCO).

Matrix Biol. 2020-8

[2]
Cataract surgeon viewpoints on the need for novel preventative anti-inflammatory and anti-posterior capsular opacification therapies.

Curr Med Res Opin. 2019-8-28

[3]
Lens Epithelial Cells Initiate an Inflammatory Response Following Cataract Surgery.

Invest Ophthalmol Vis Sci. 2018-10-1

[4]
Spatiotemporal dynamics of canonical Wnt signaling during embryonic eye development and posterior capsular opacification (PCO).

Exp Eye Res. 2018-6-19

[5]
Ki-67: more than a proliferation marker.

Chromosoma. 2018-6

[6]
Automated Quantification and Analysis of Cell Counting Procedures Using ImageJ Plugins.

J Vis Exp. 2016-11-17

[7]
Determination of collagen content within picrosirius red stained paraffin-embedded tissue sections using fluorescence microscopy.

MethodsX. 2015-2-21

[8]
Automatic cell counting with ImageJ.

Anal Biochem. 2015-3-15

[9]
Partial inhibition of Cdk1 in G 2 phase overrides the SAC and decouples mitotic events.

Cell Cycle. 2014

[10]
Beta-1 integrin is important for the structural maintenance and homeostasis of differentiating fiber cells.

Int J Biochem Cell Biol. 2014-5

文献AI研究员

20分钟写一篇综述,助力文献阅读效率提升50倍

立即体验

用中文搜PubMed

大模型驱动的PubMed中文搜索引擎

马上搜索

推荐工具

医学文档翻译智能文献检索